
“Semen and Semantics: Understanding Porn with Language Embeddings” by future_detective
LessWrong (30+ Karma)
Shownotes Transcript
** Summary**
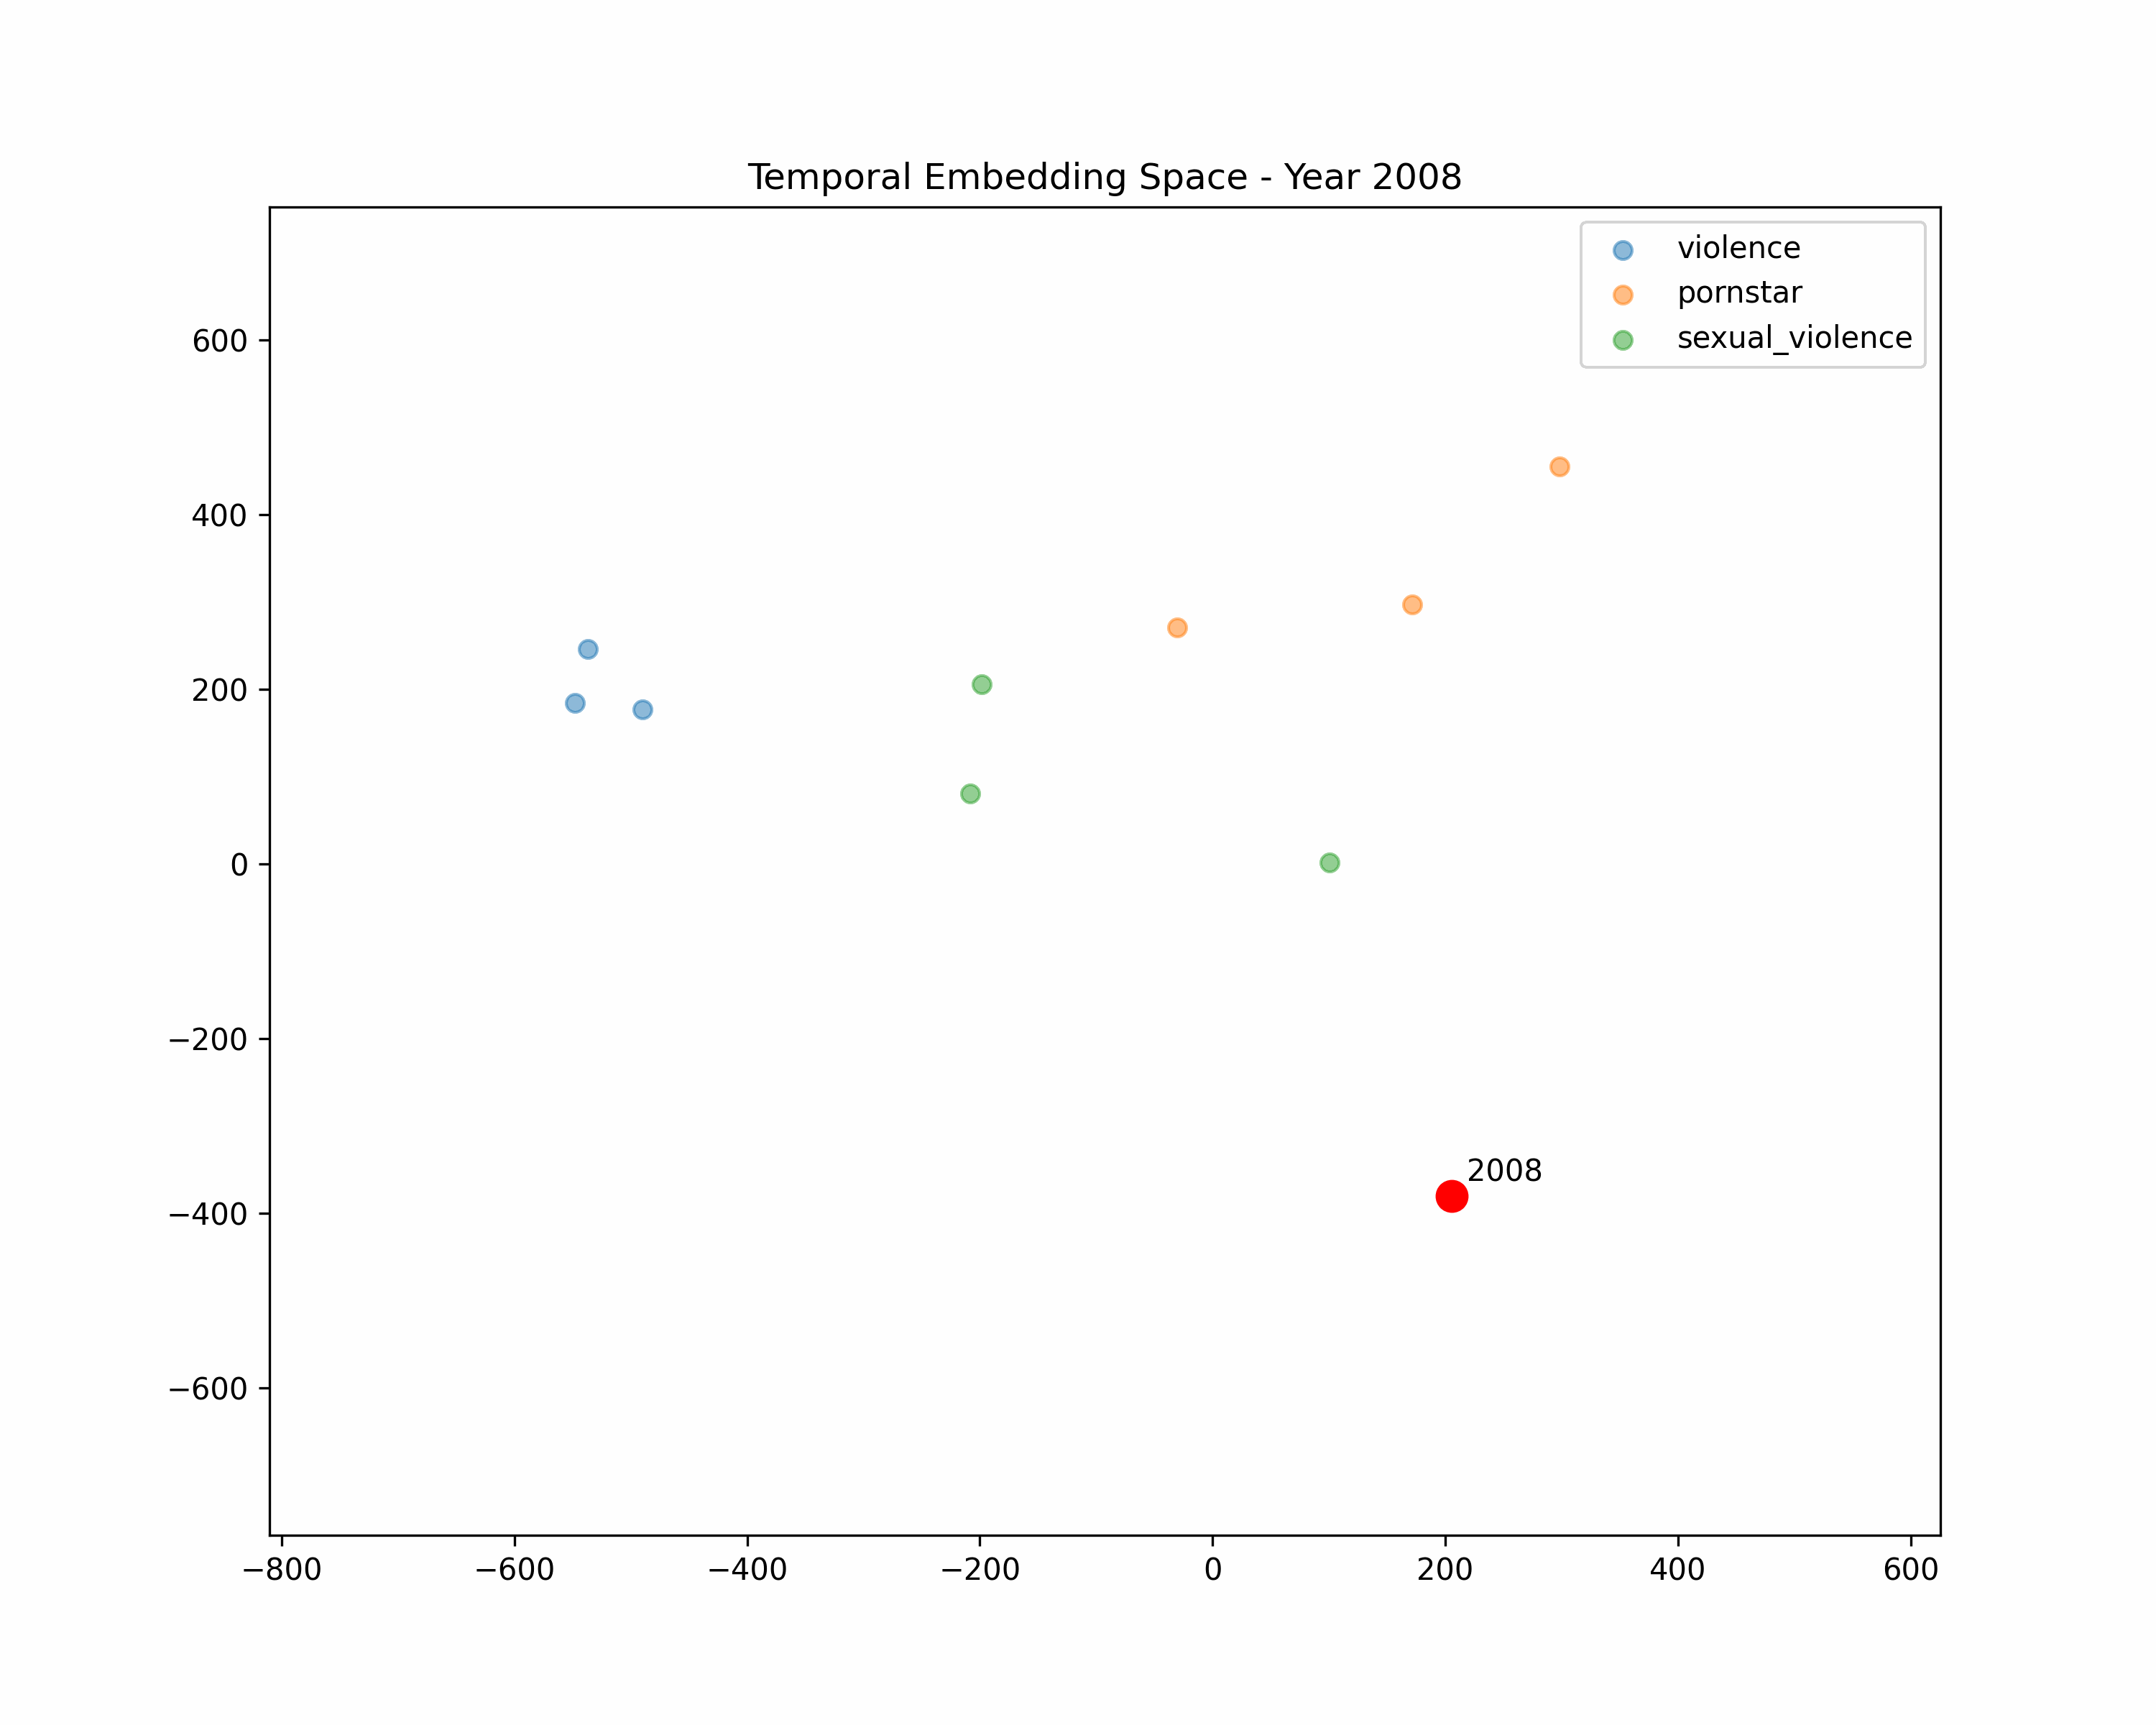
Porn content has gotten more extreme over time. Here's the average title for the first full year of Pornhub's existence, 2008:
- "Hot blonde girl gets fucked"
and here's the average title for 2023:
- "FAMILYXXX - "I Cant Resist My Stepsis Big Juicy Ass" (Mila Monet)"
Why did this change happen? We can understand porn's progression by converting titles to language embeddings. I downloaded Internet Archive snapshots of "pornhub.com" from 2008 - 2023 and analyzed the embeddings of the titles on the main page.
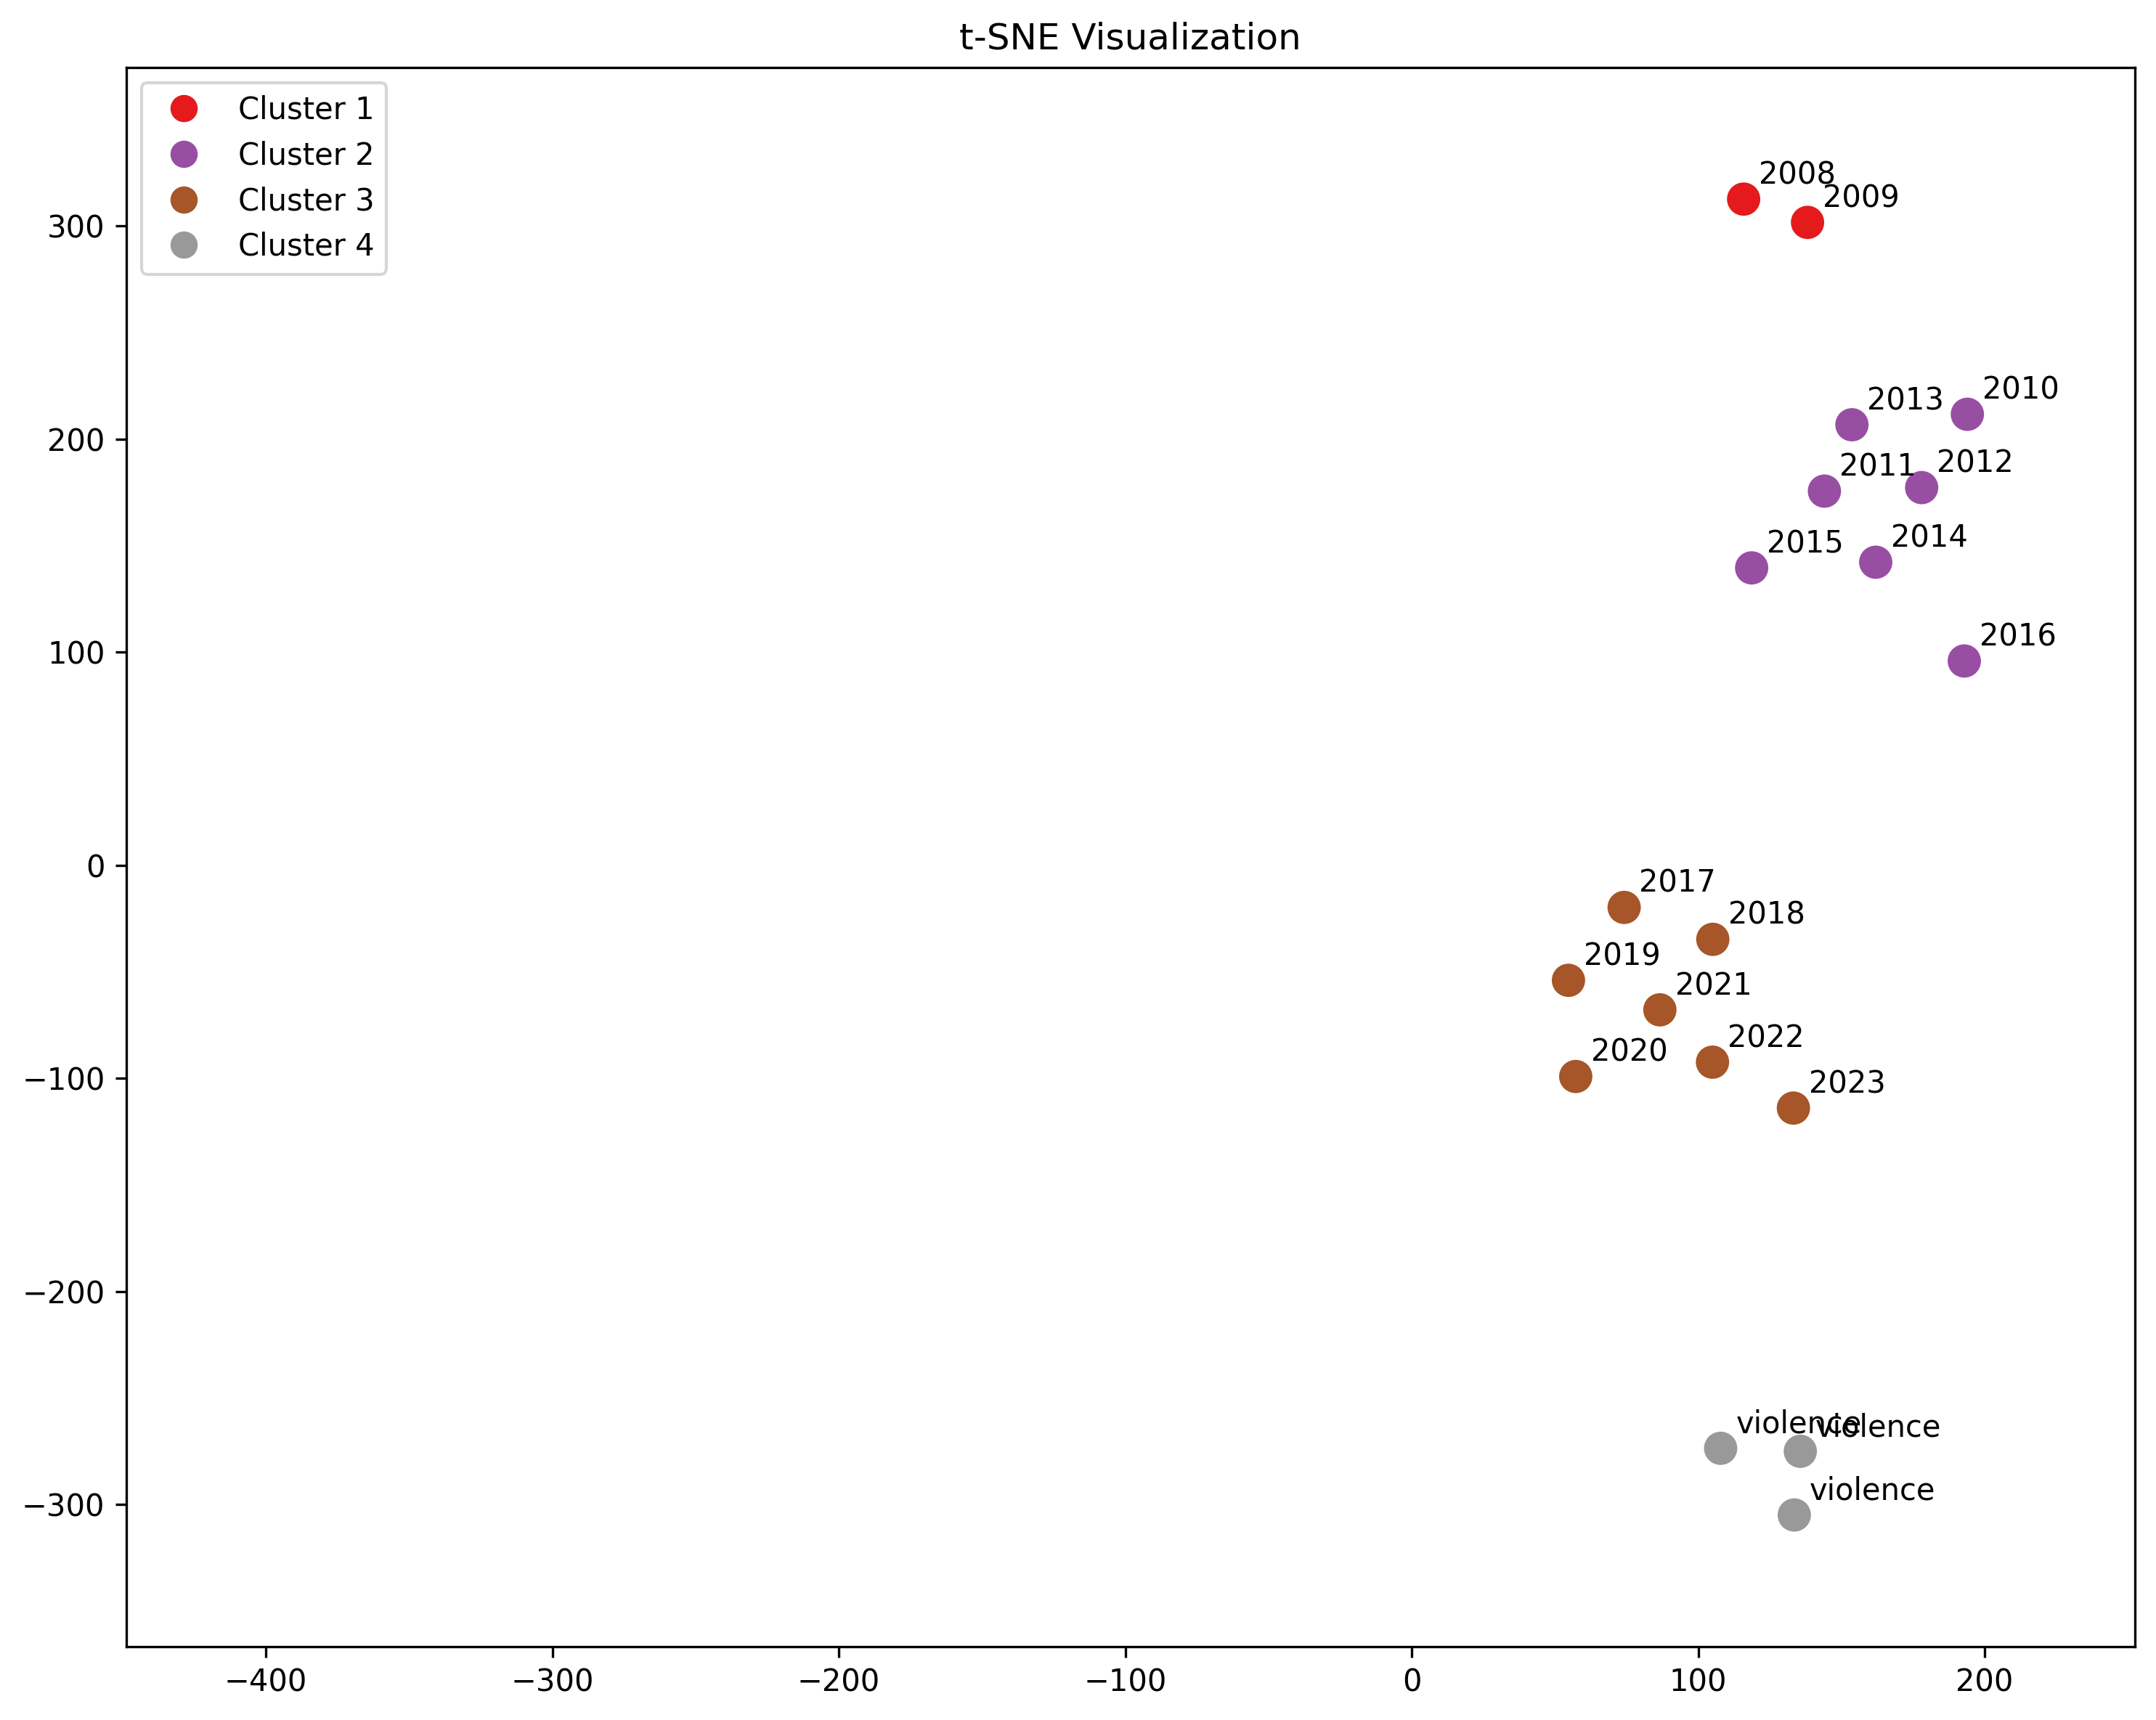
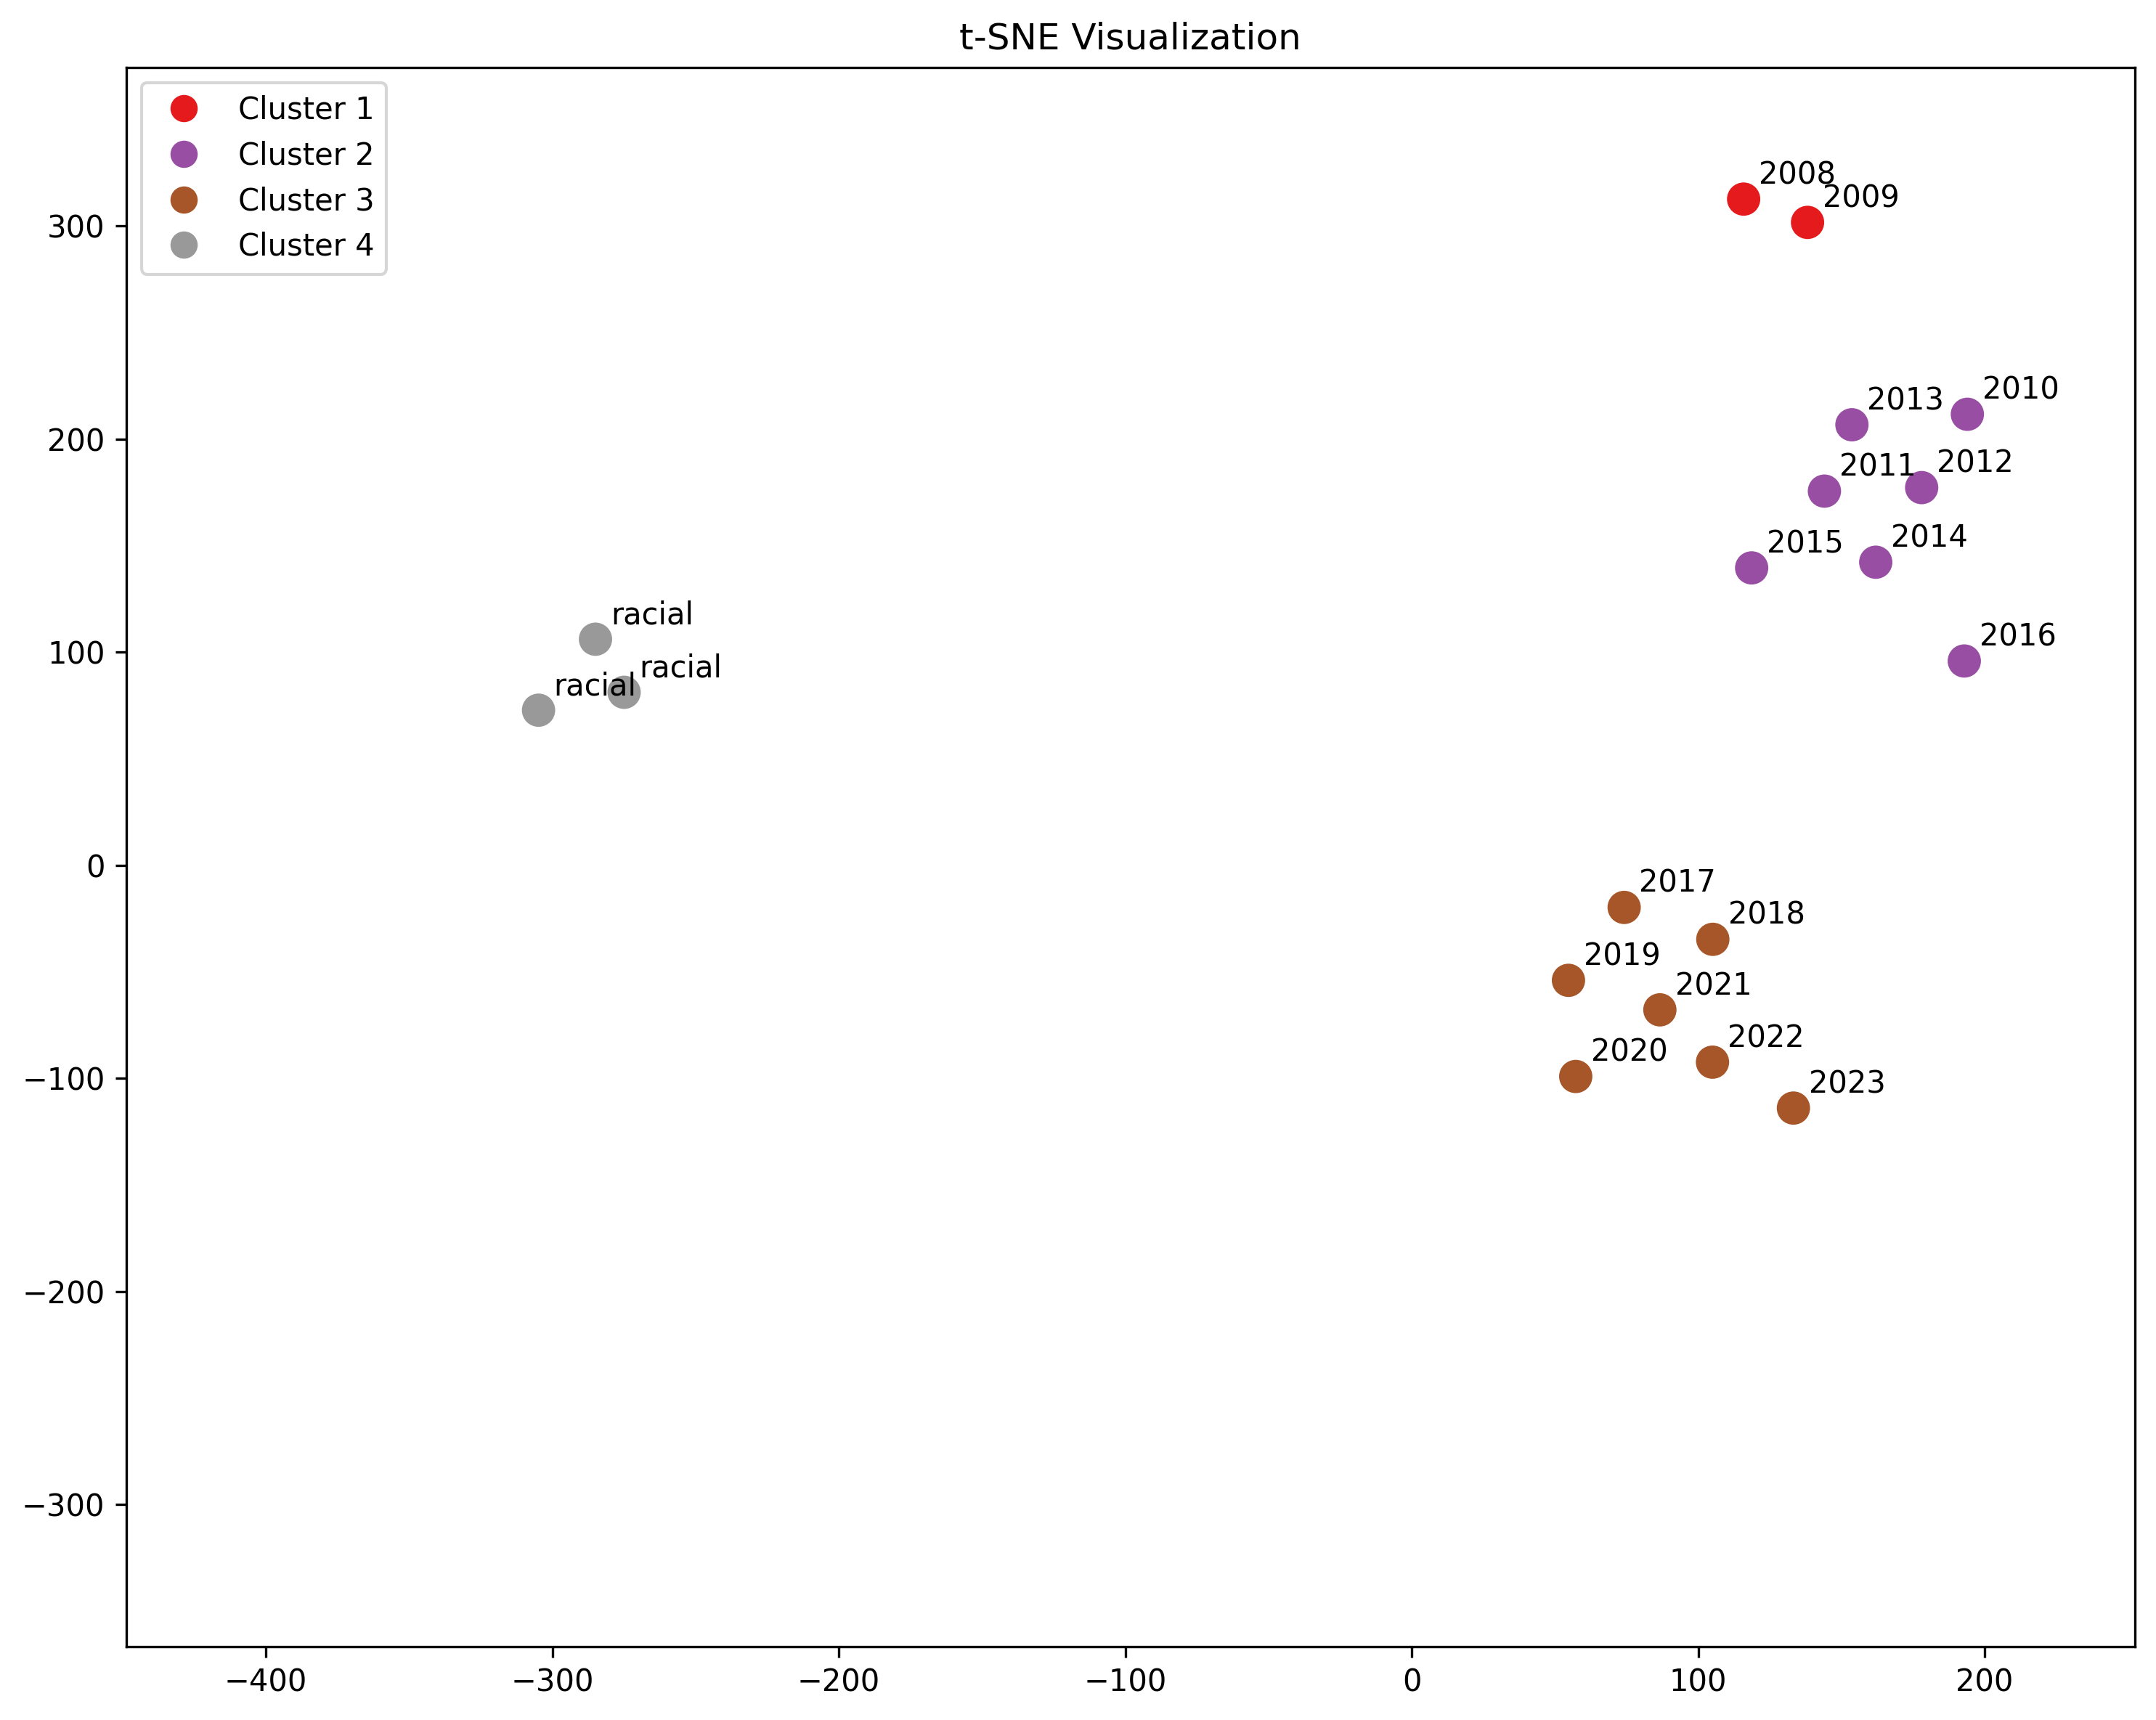
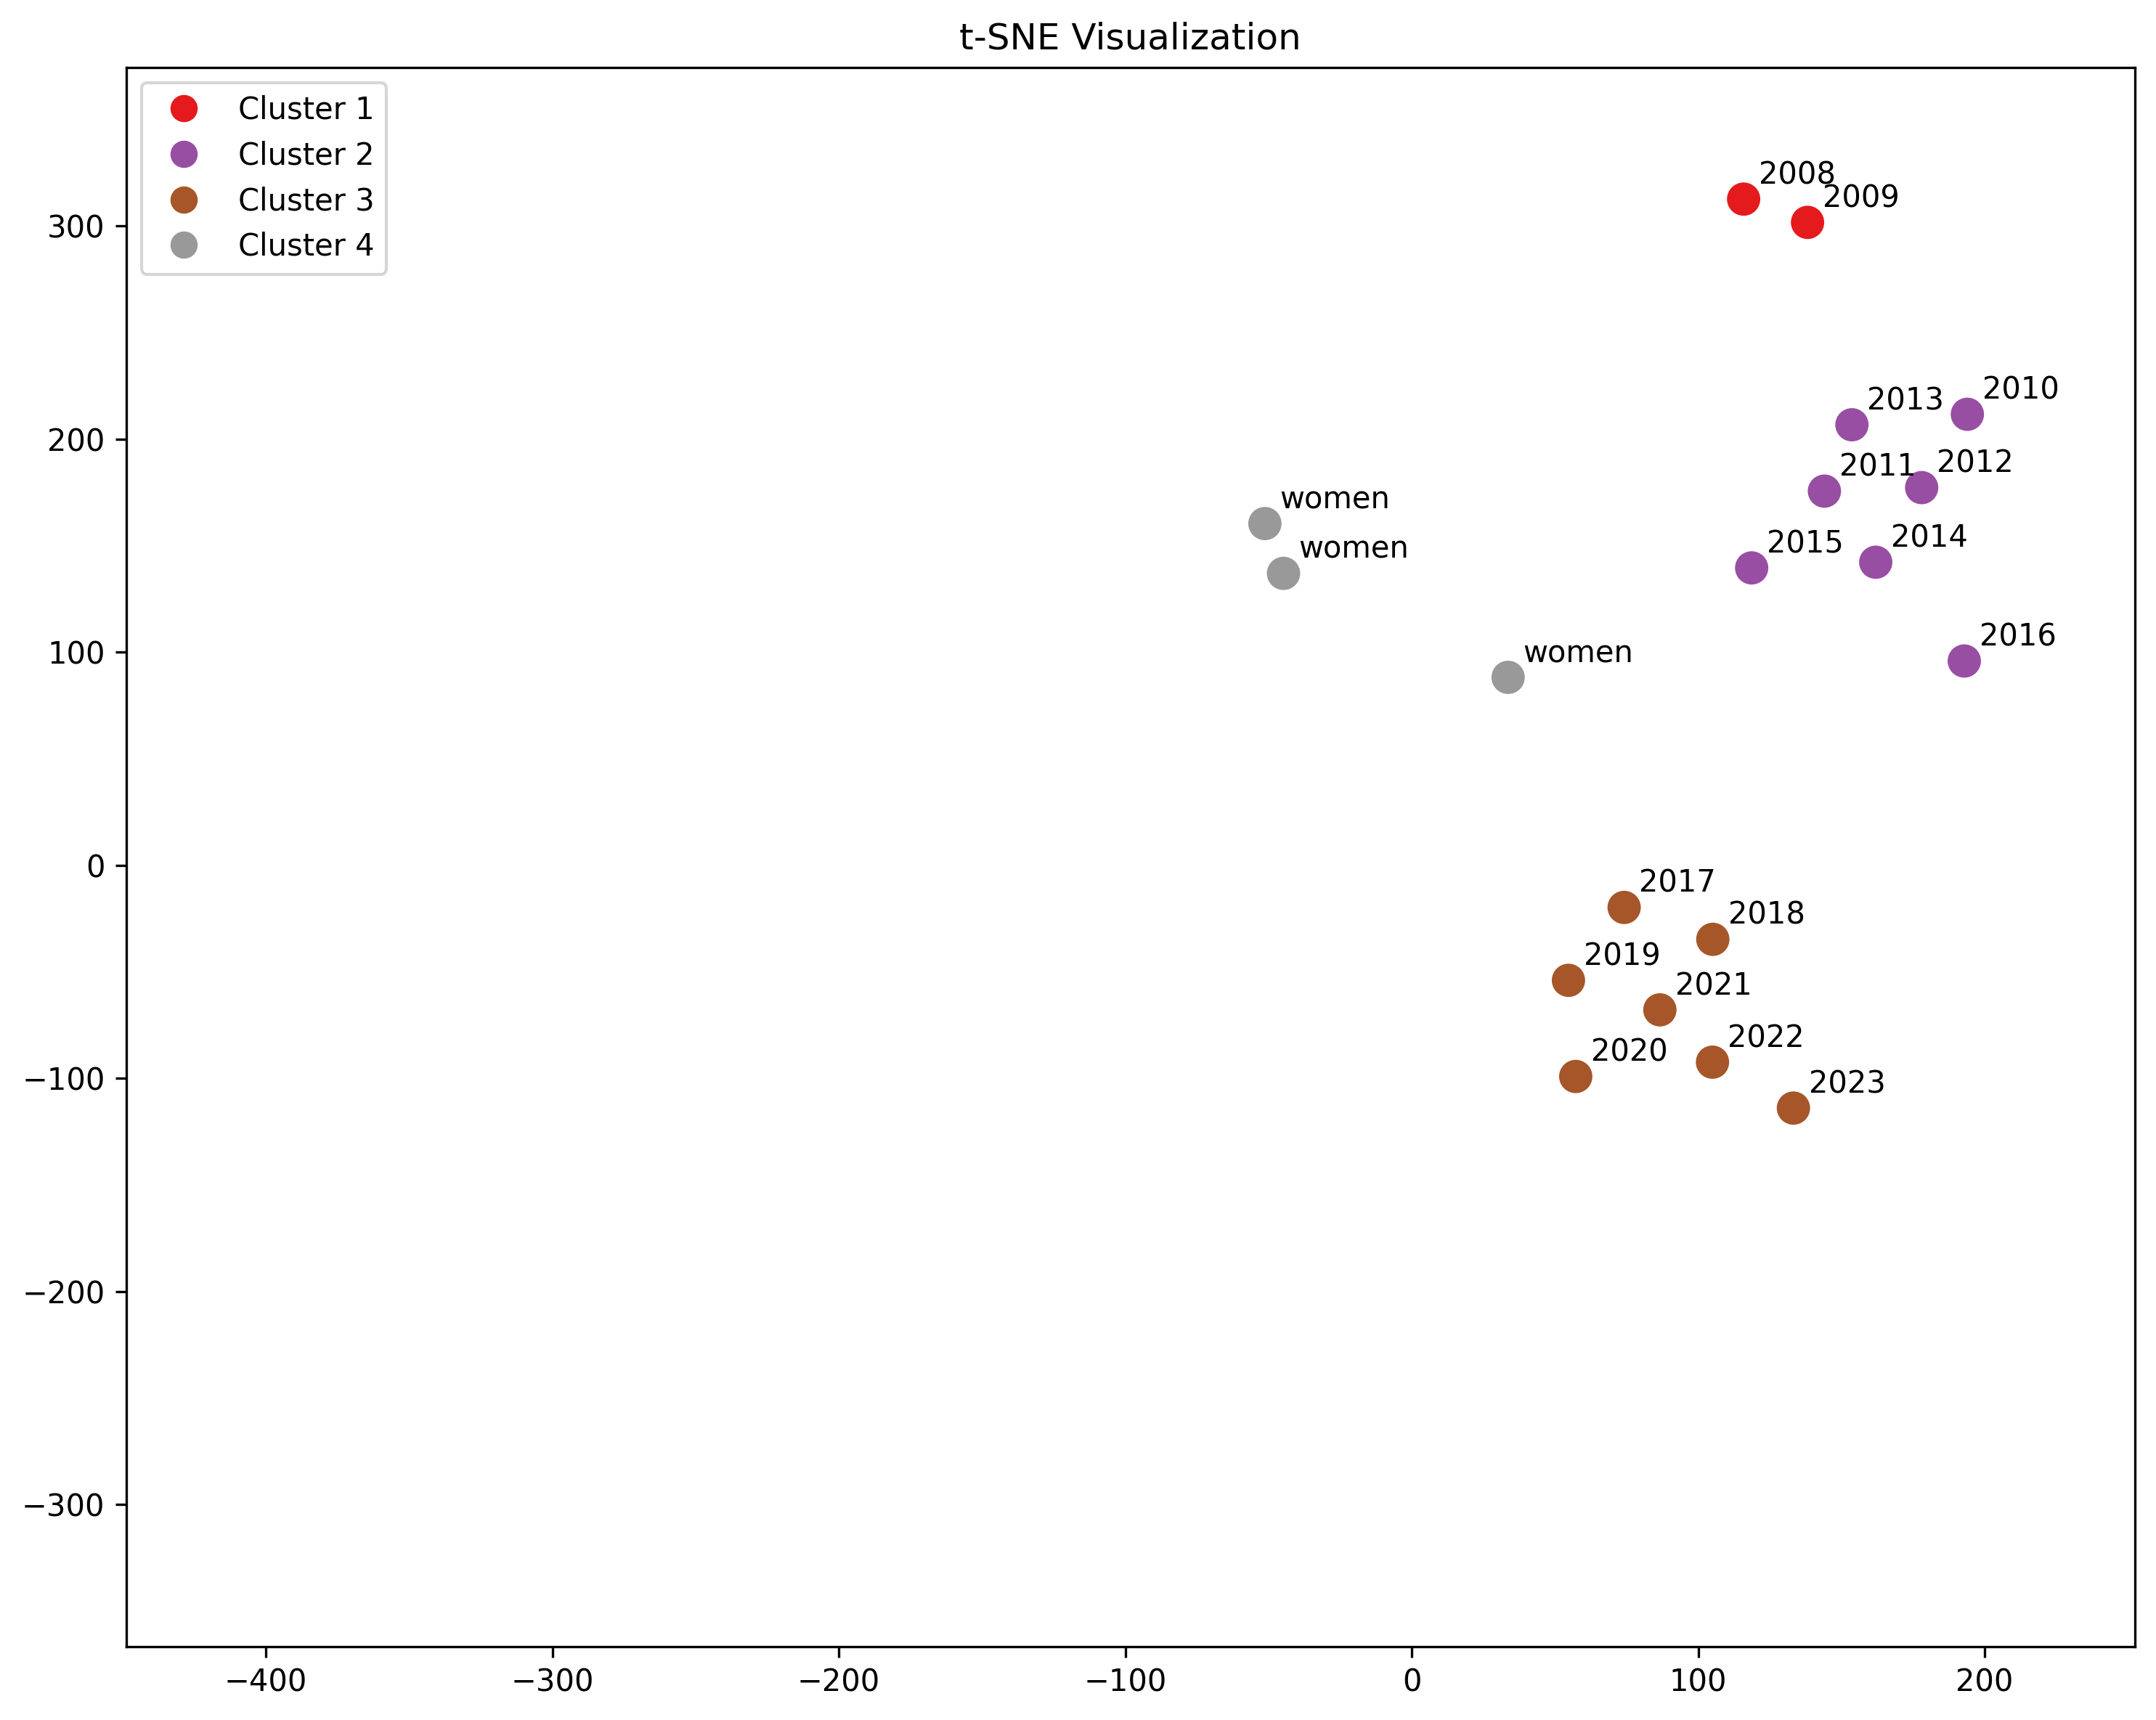
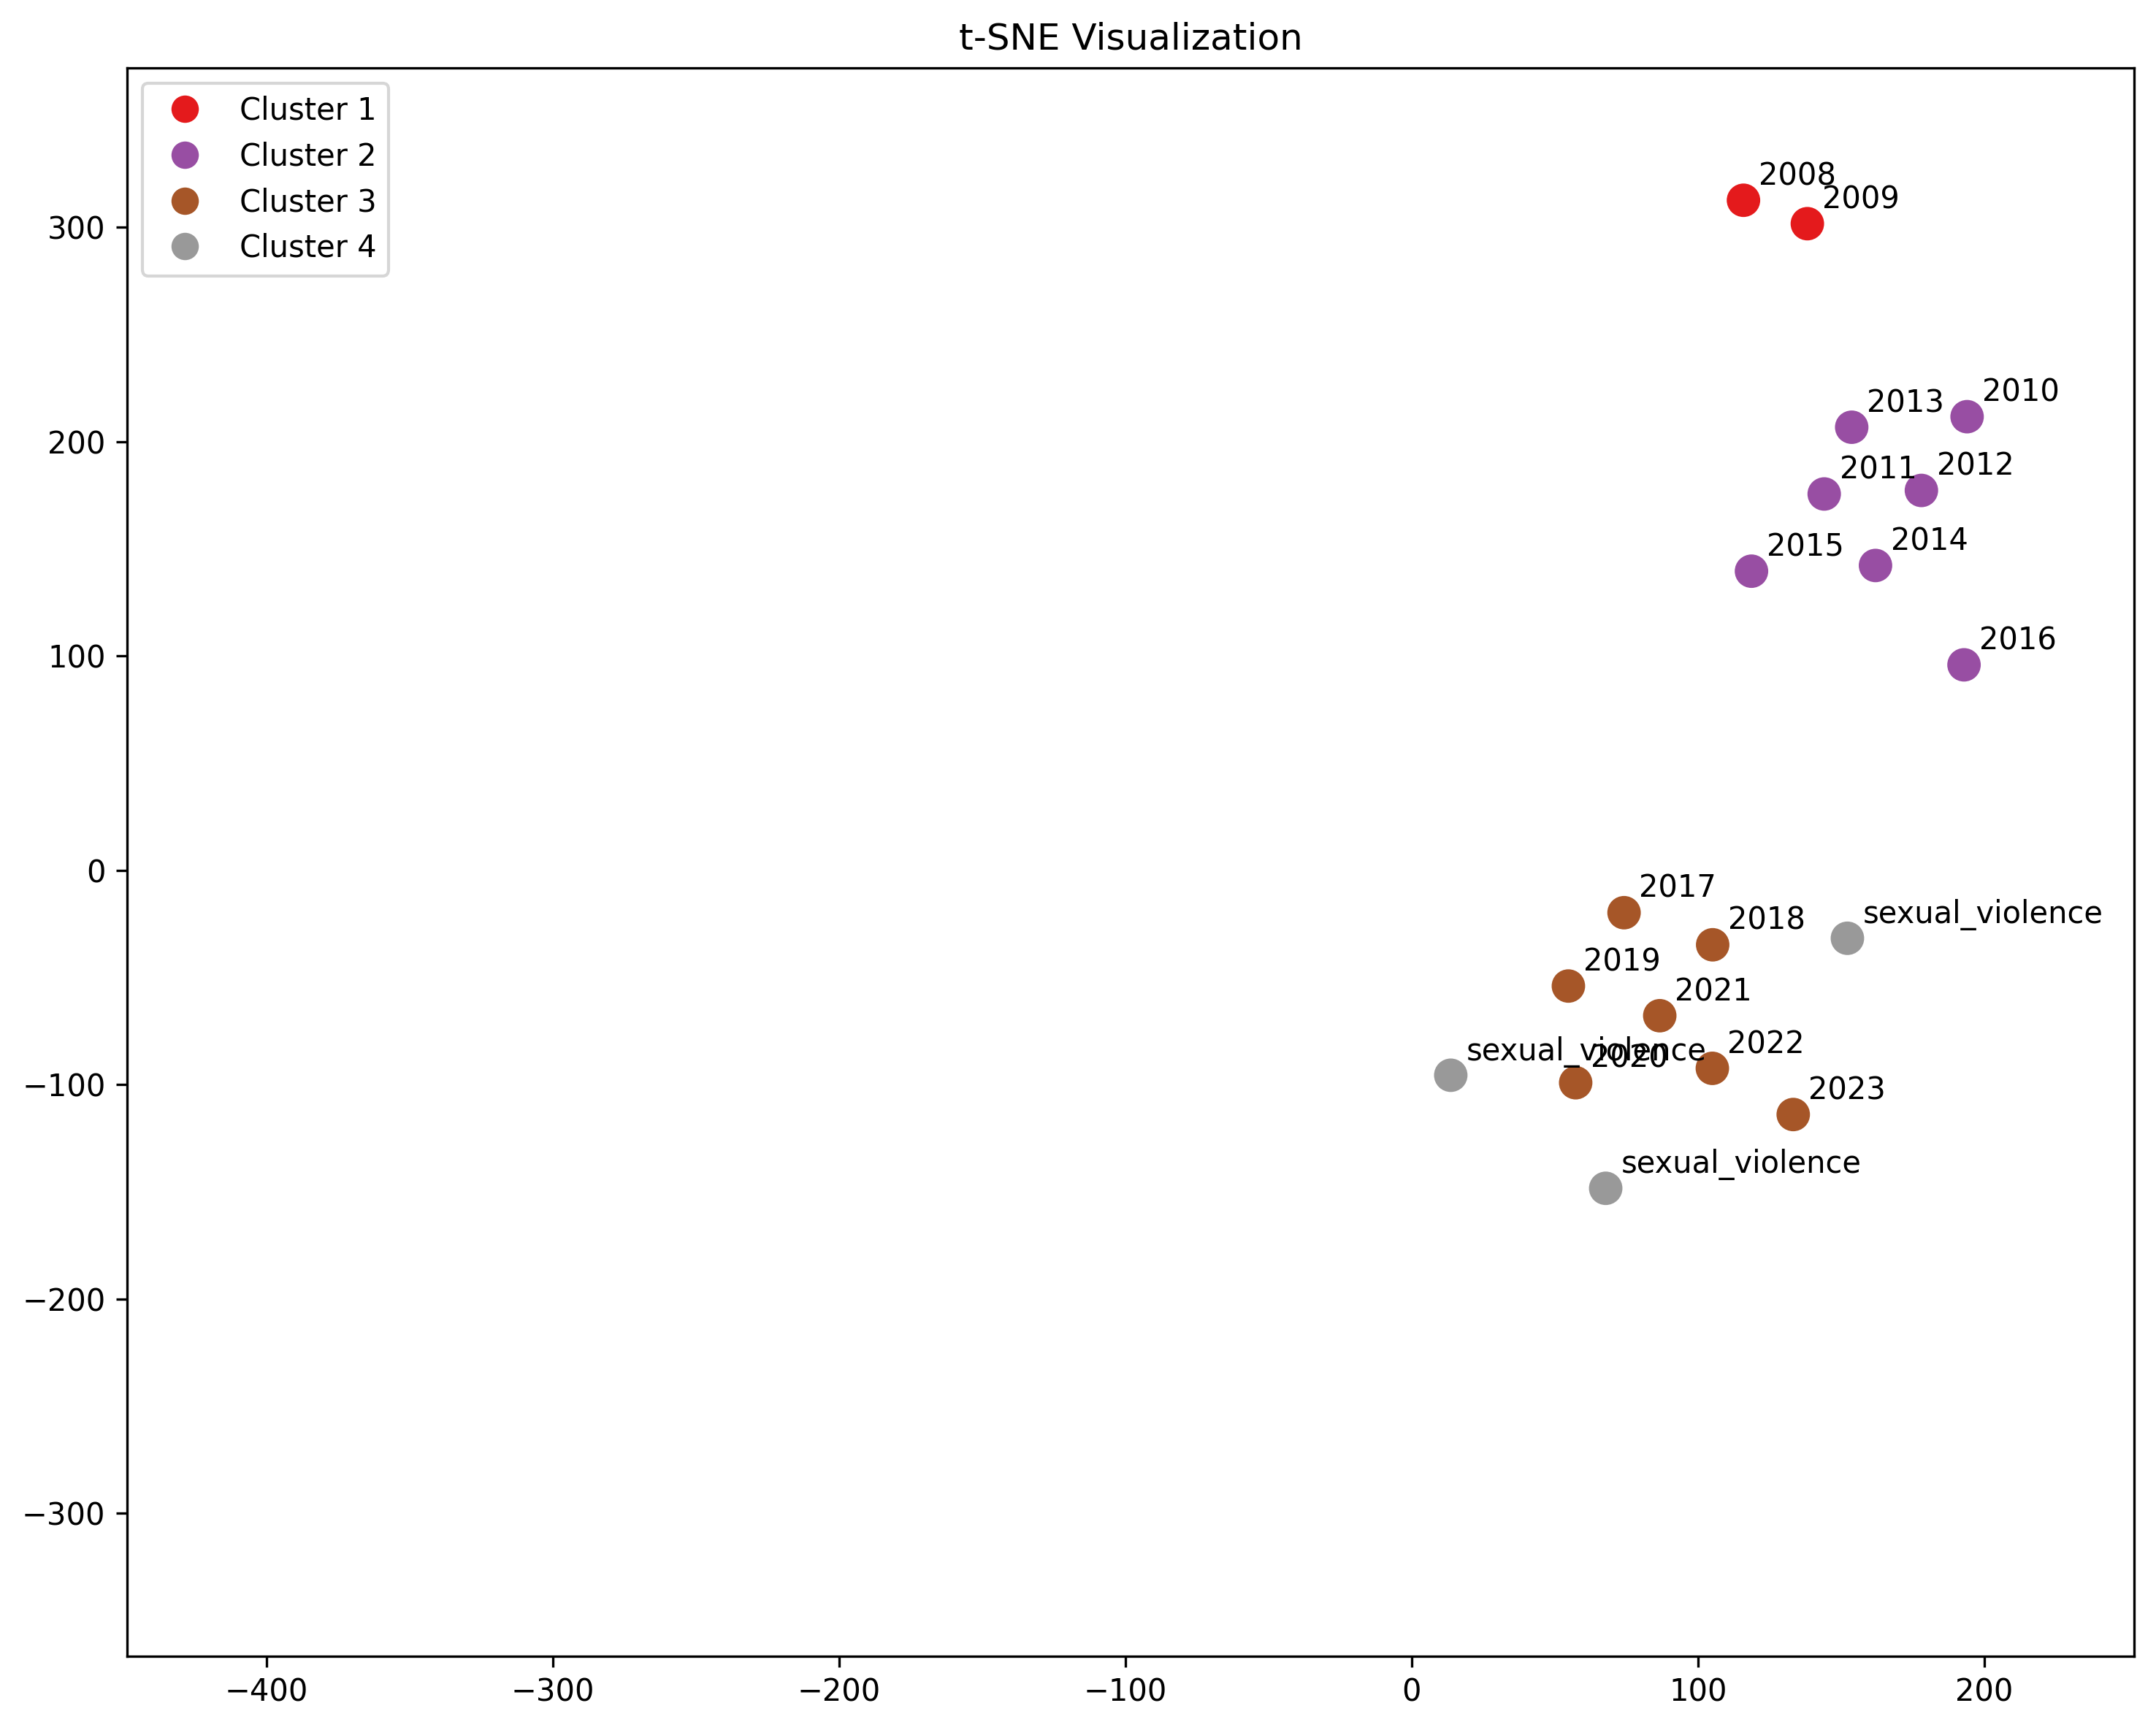
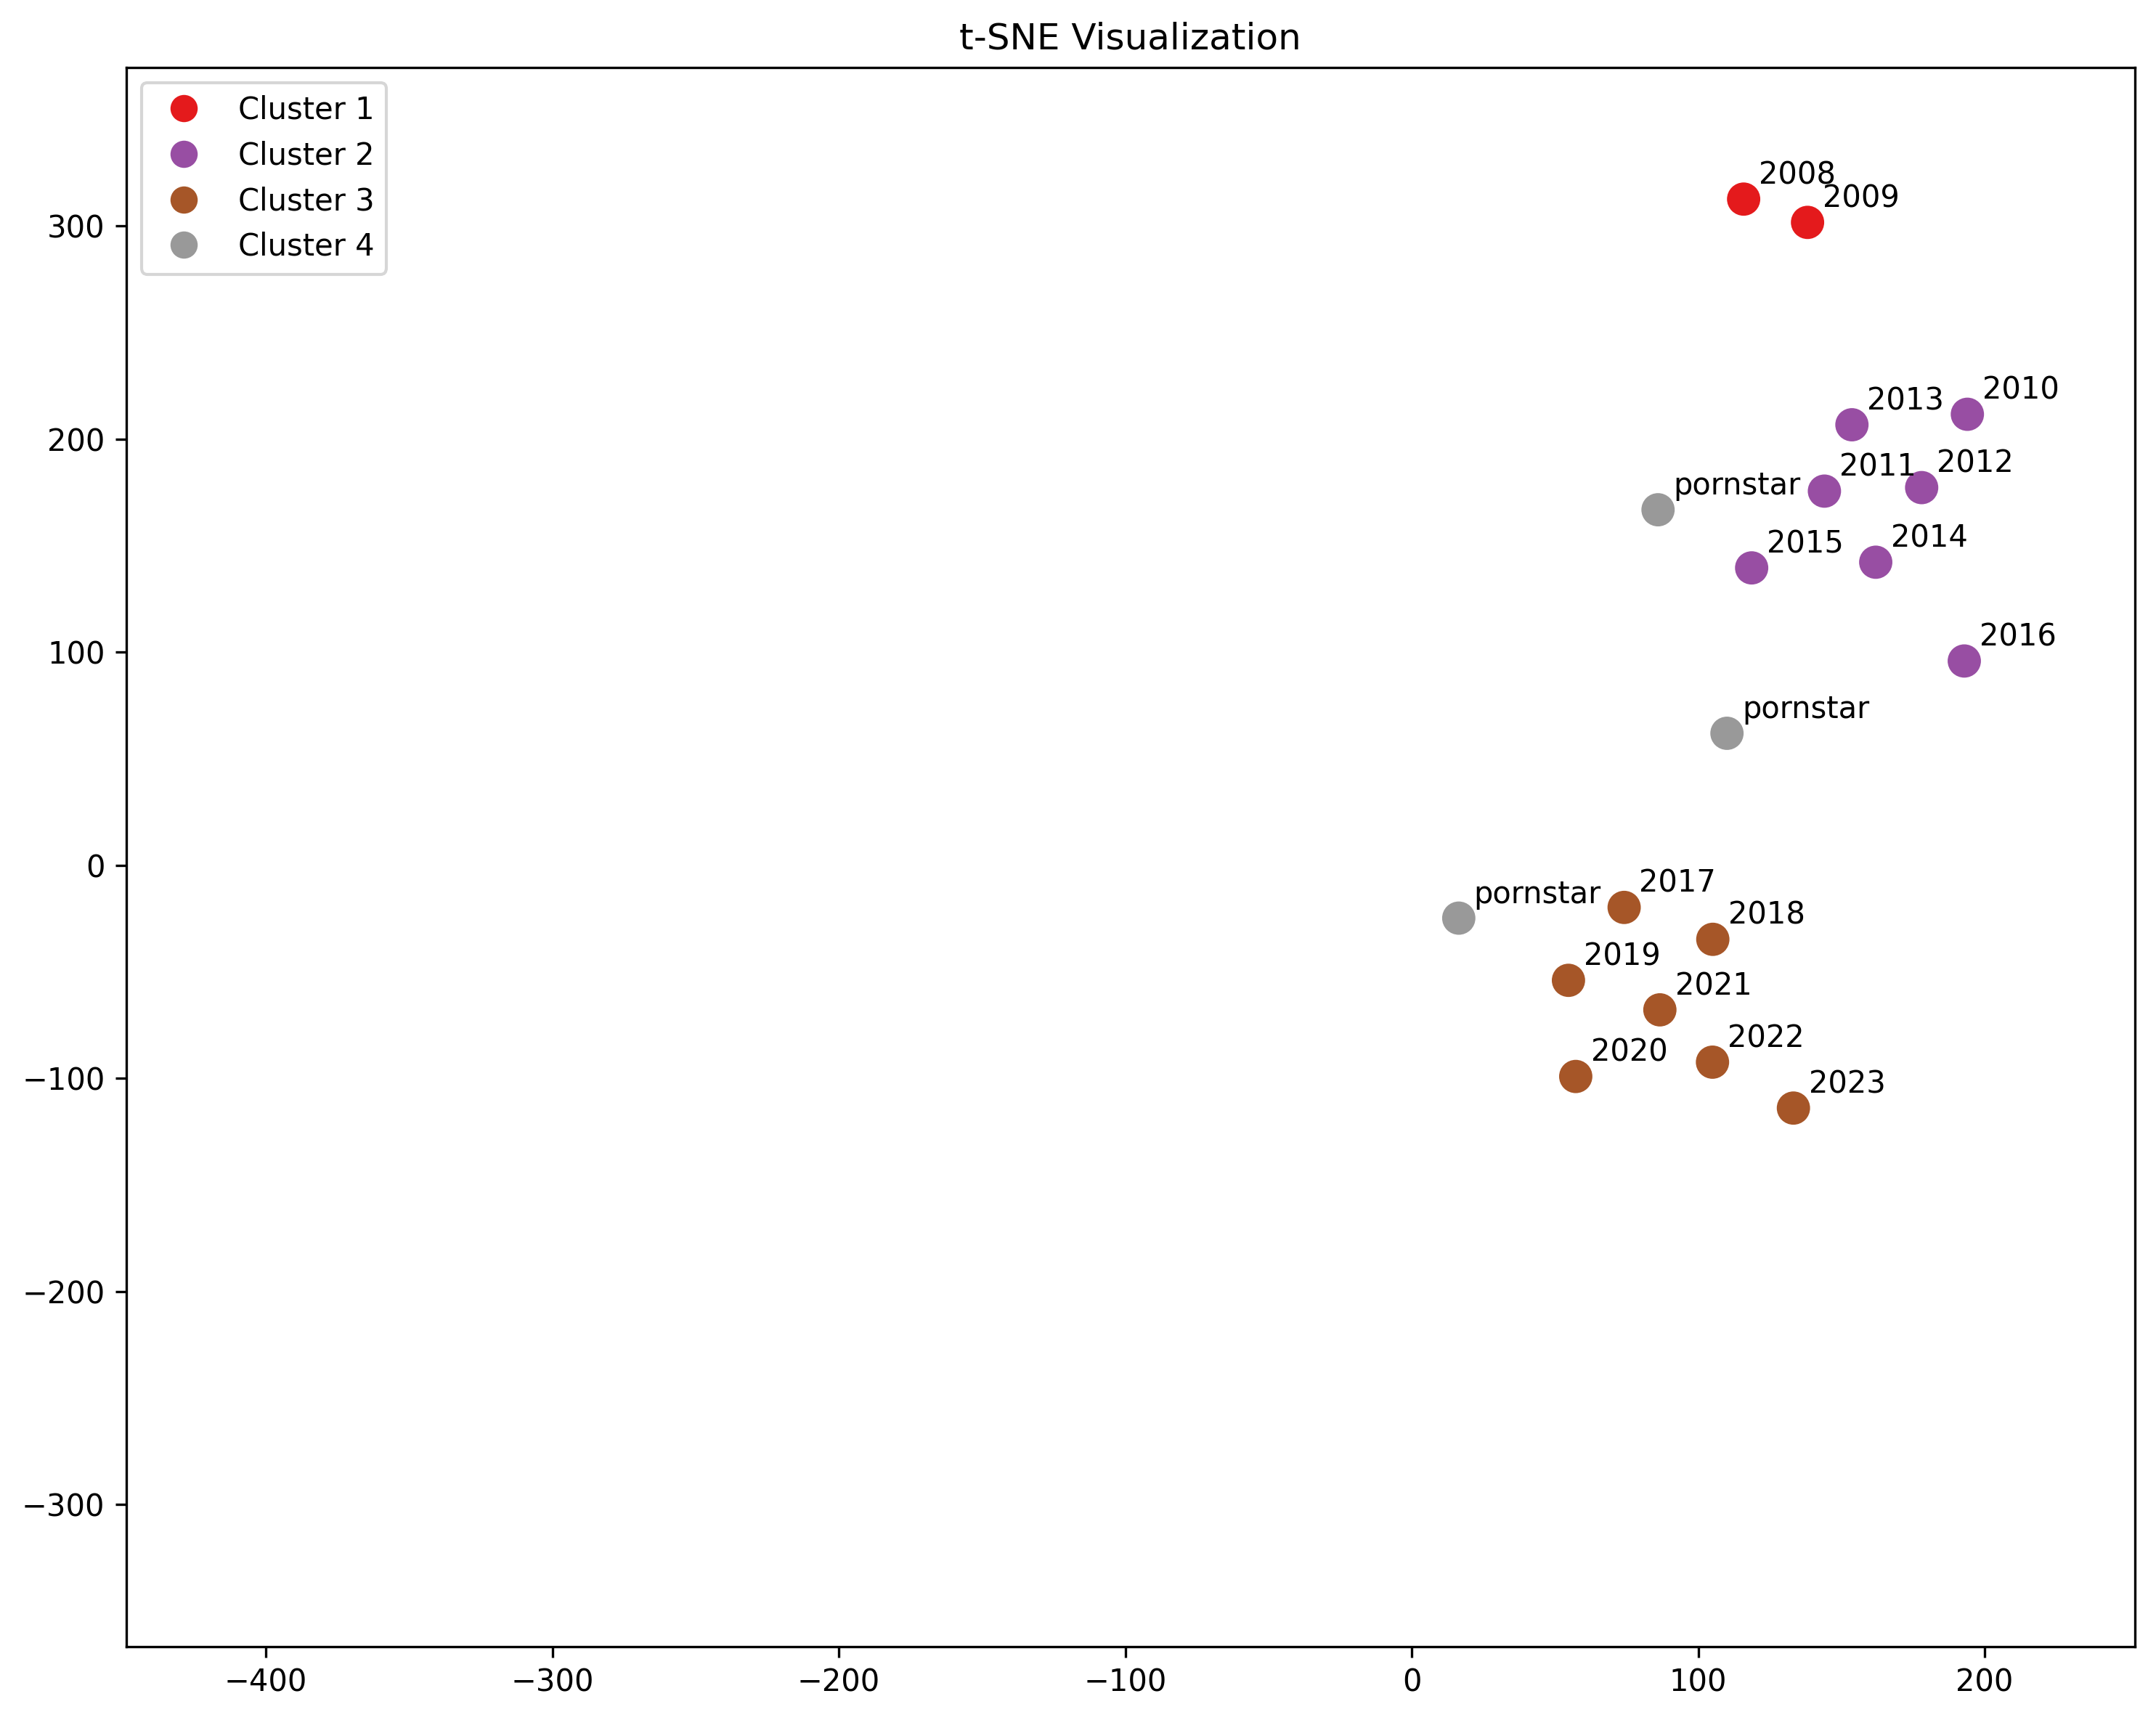
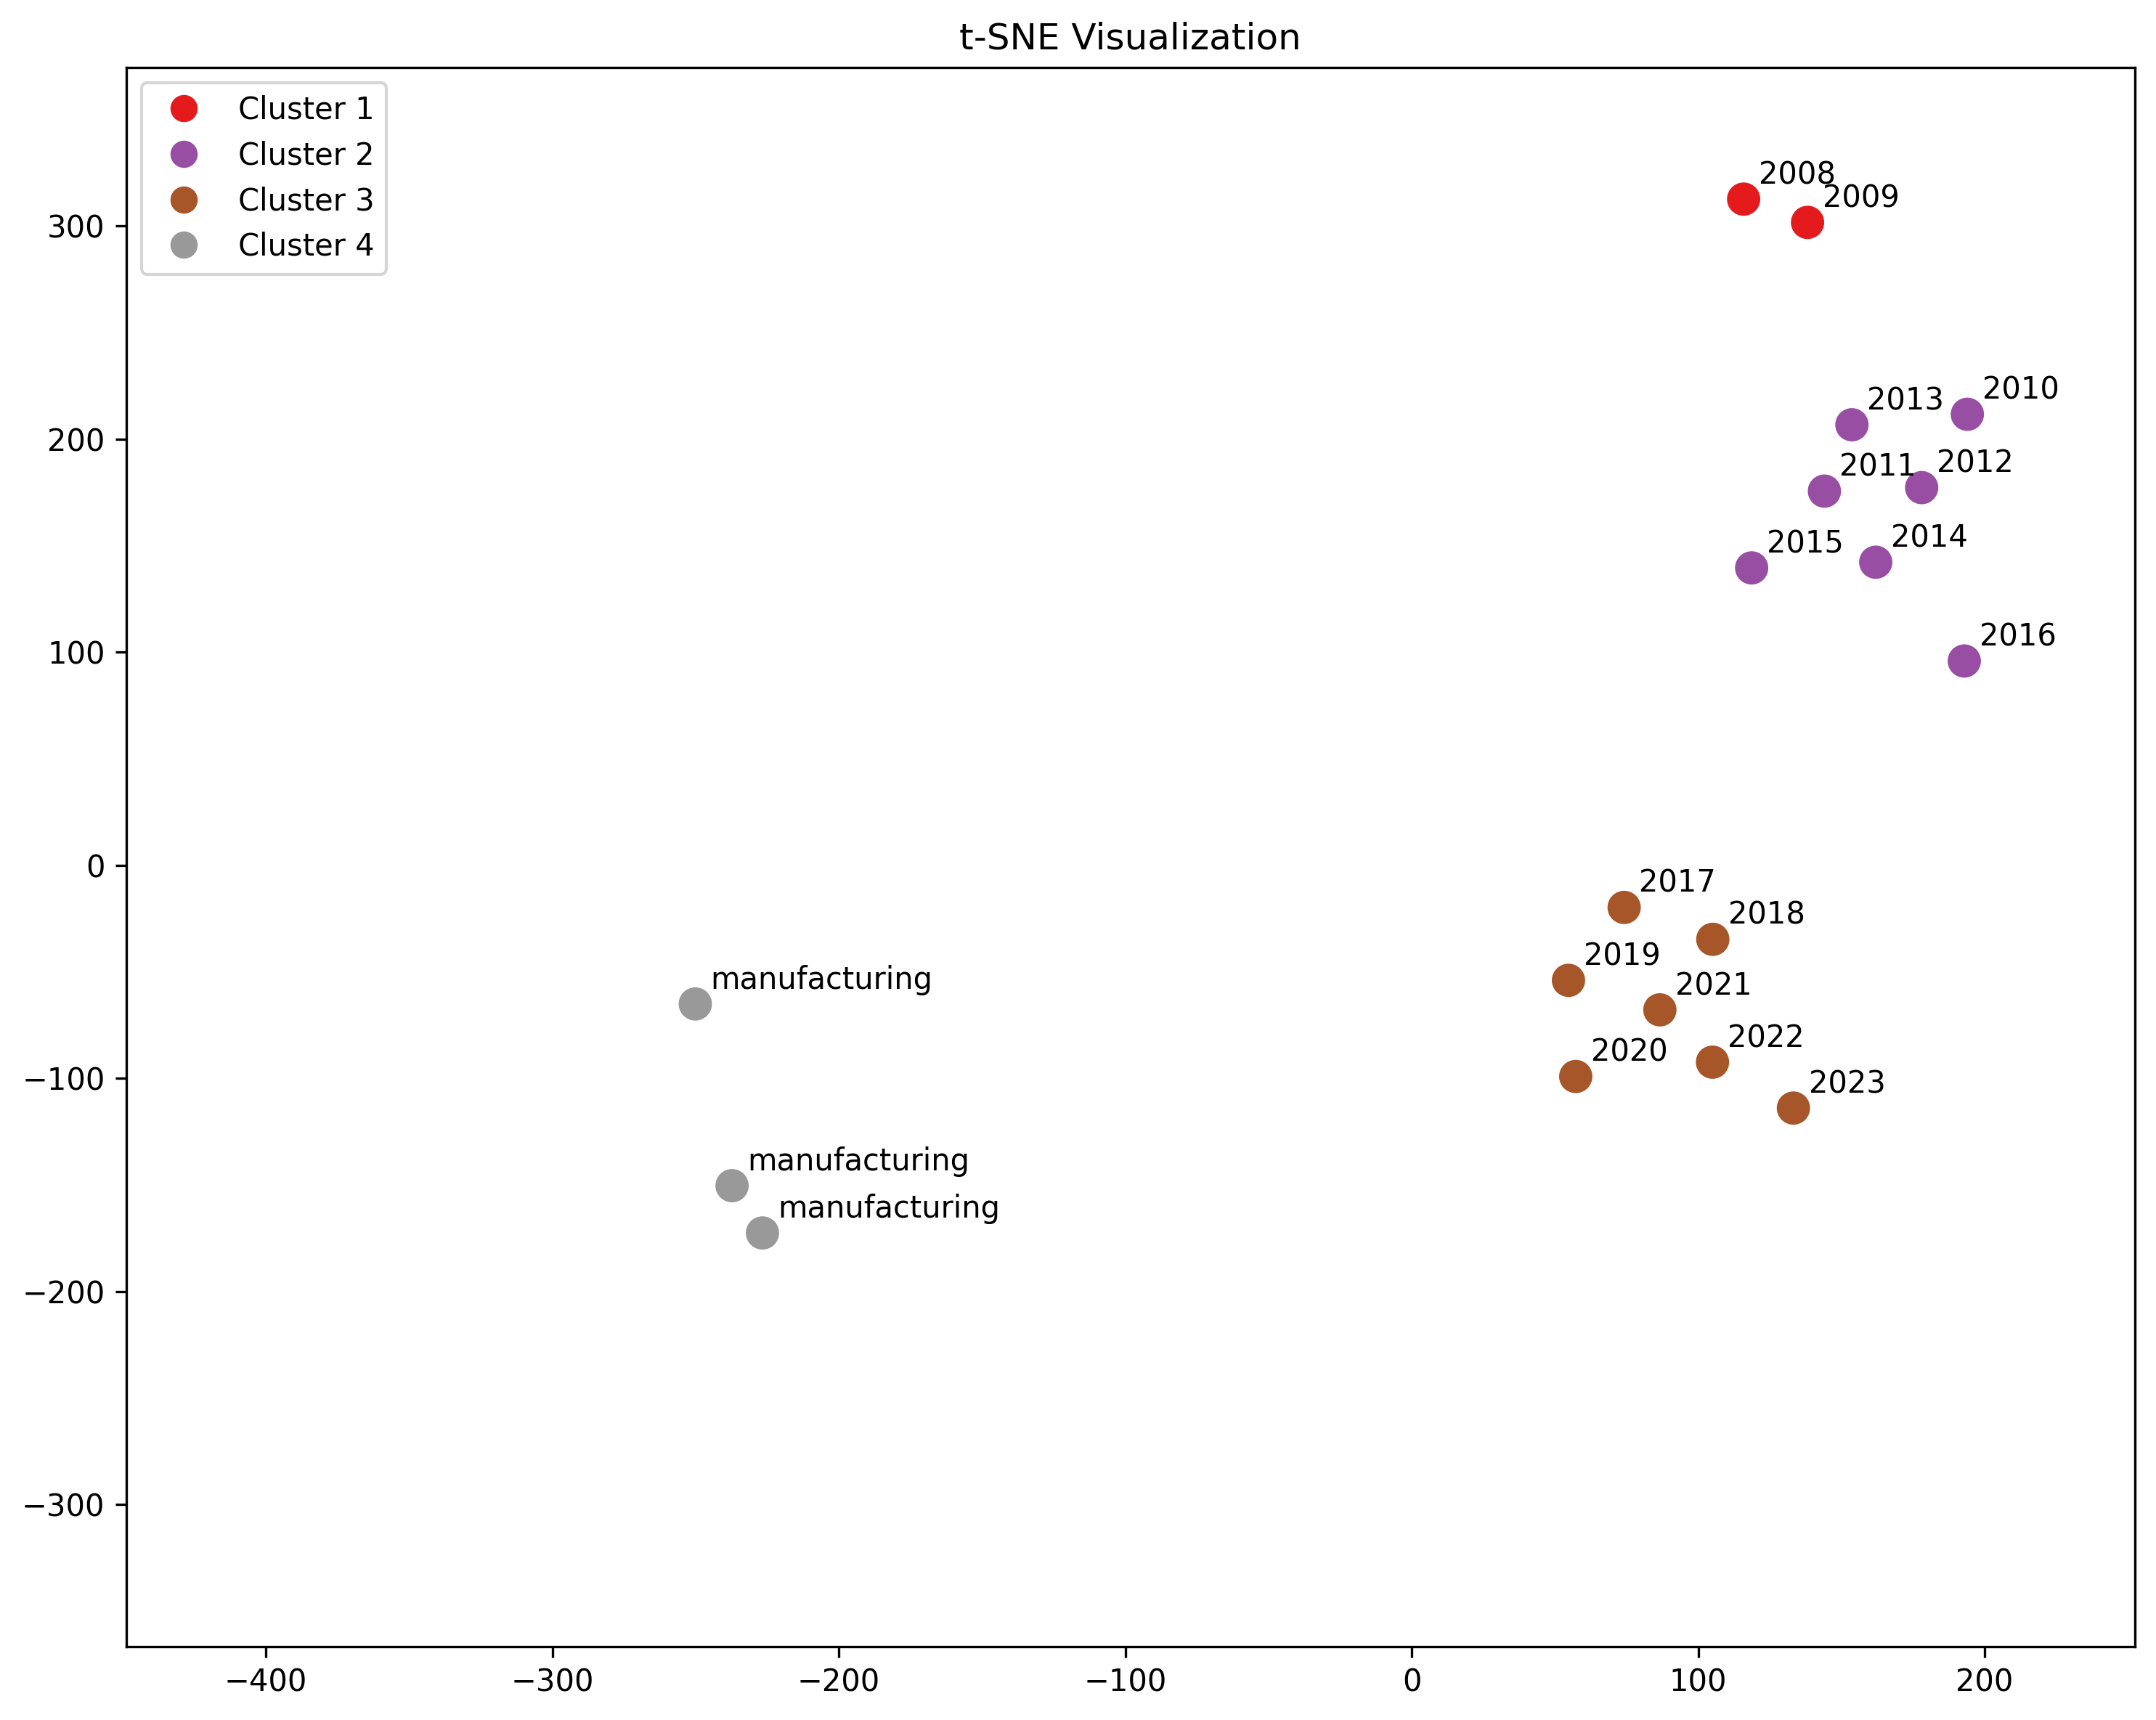
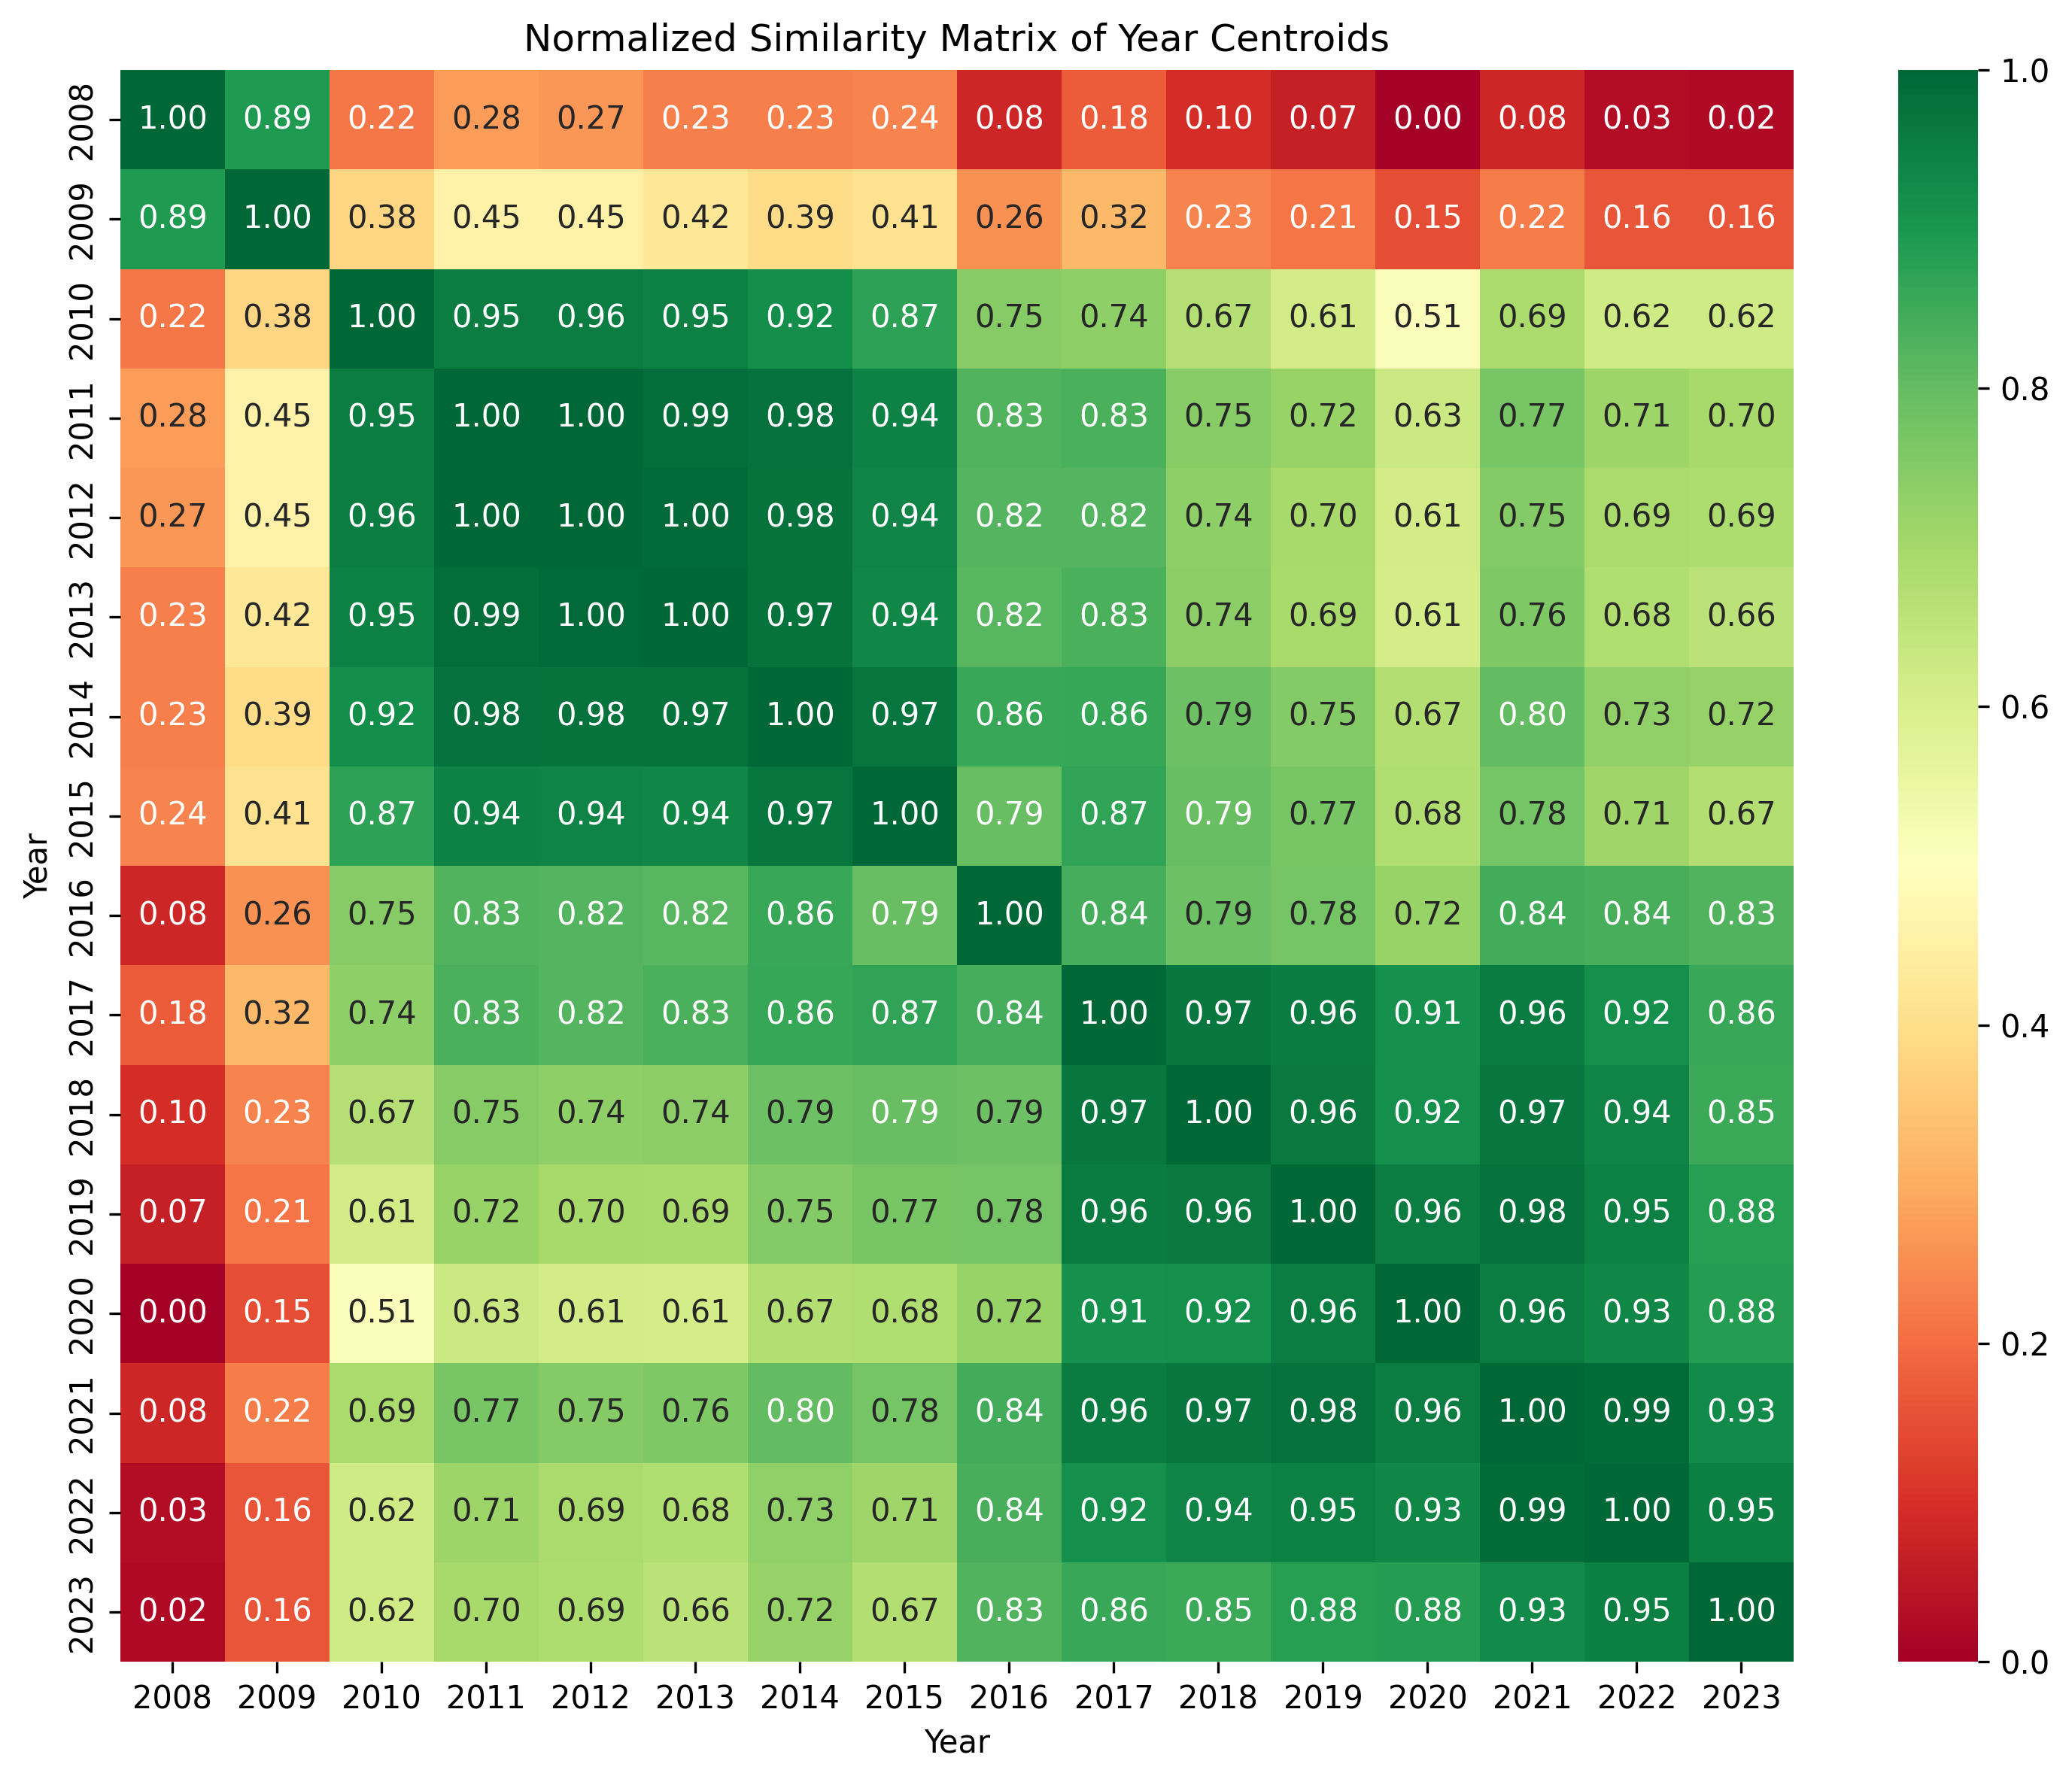
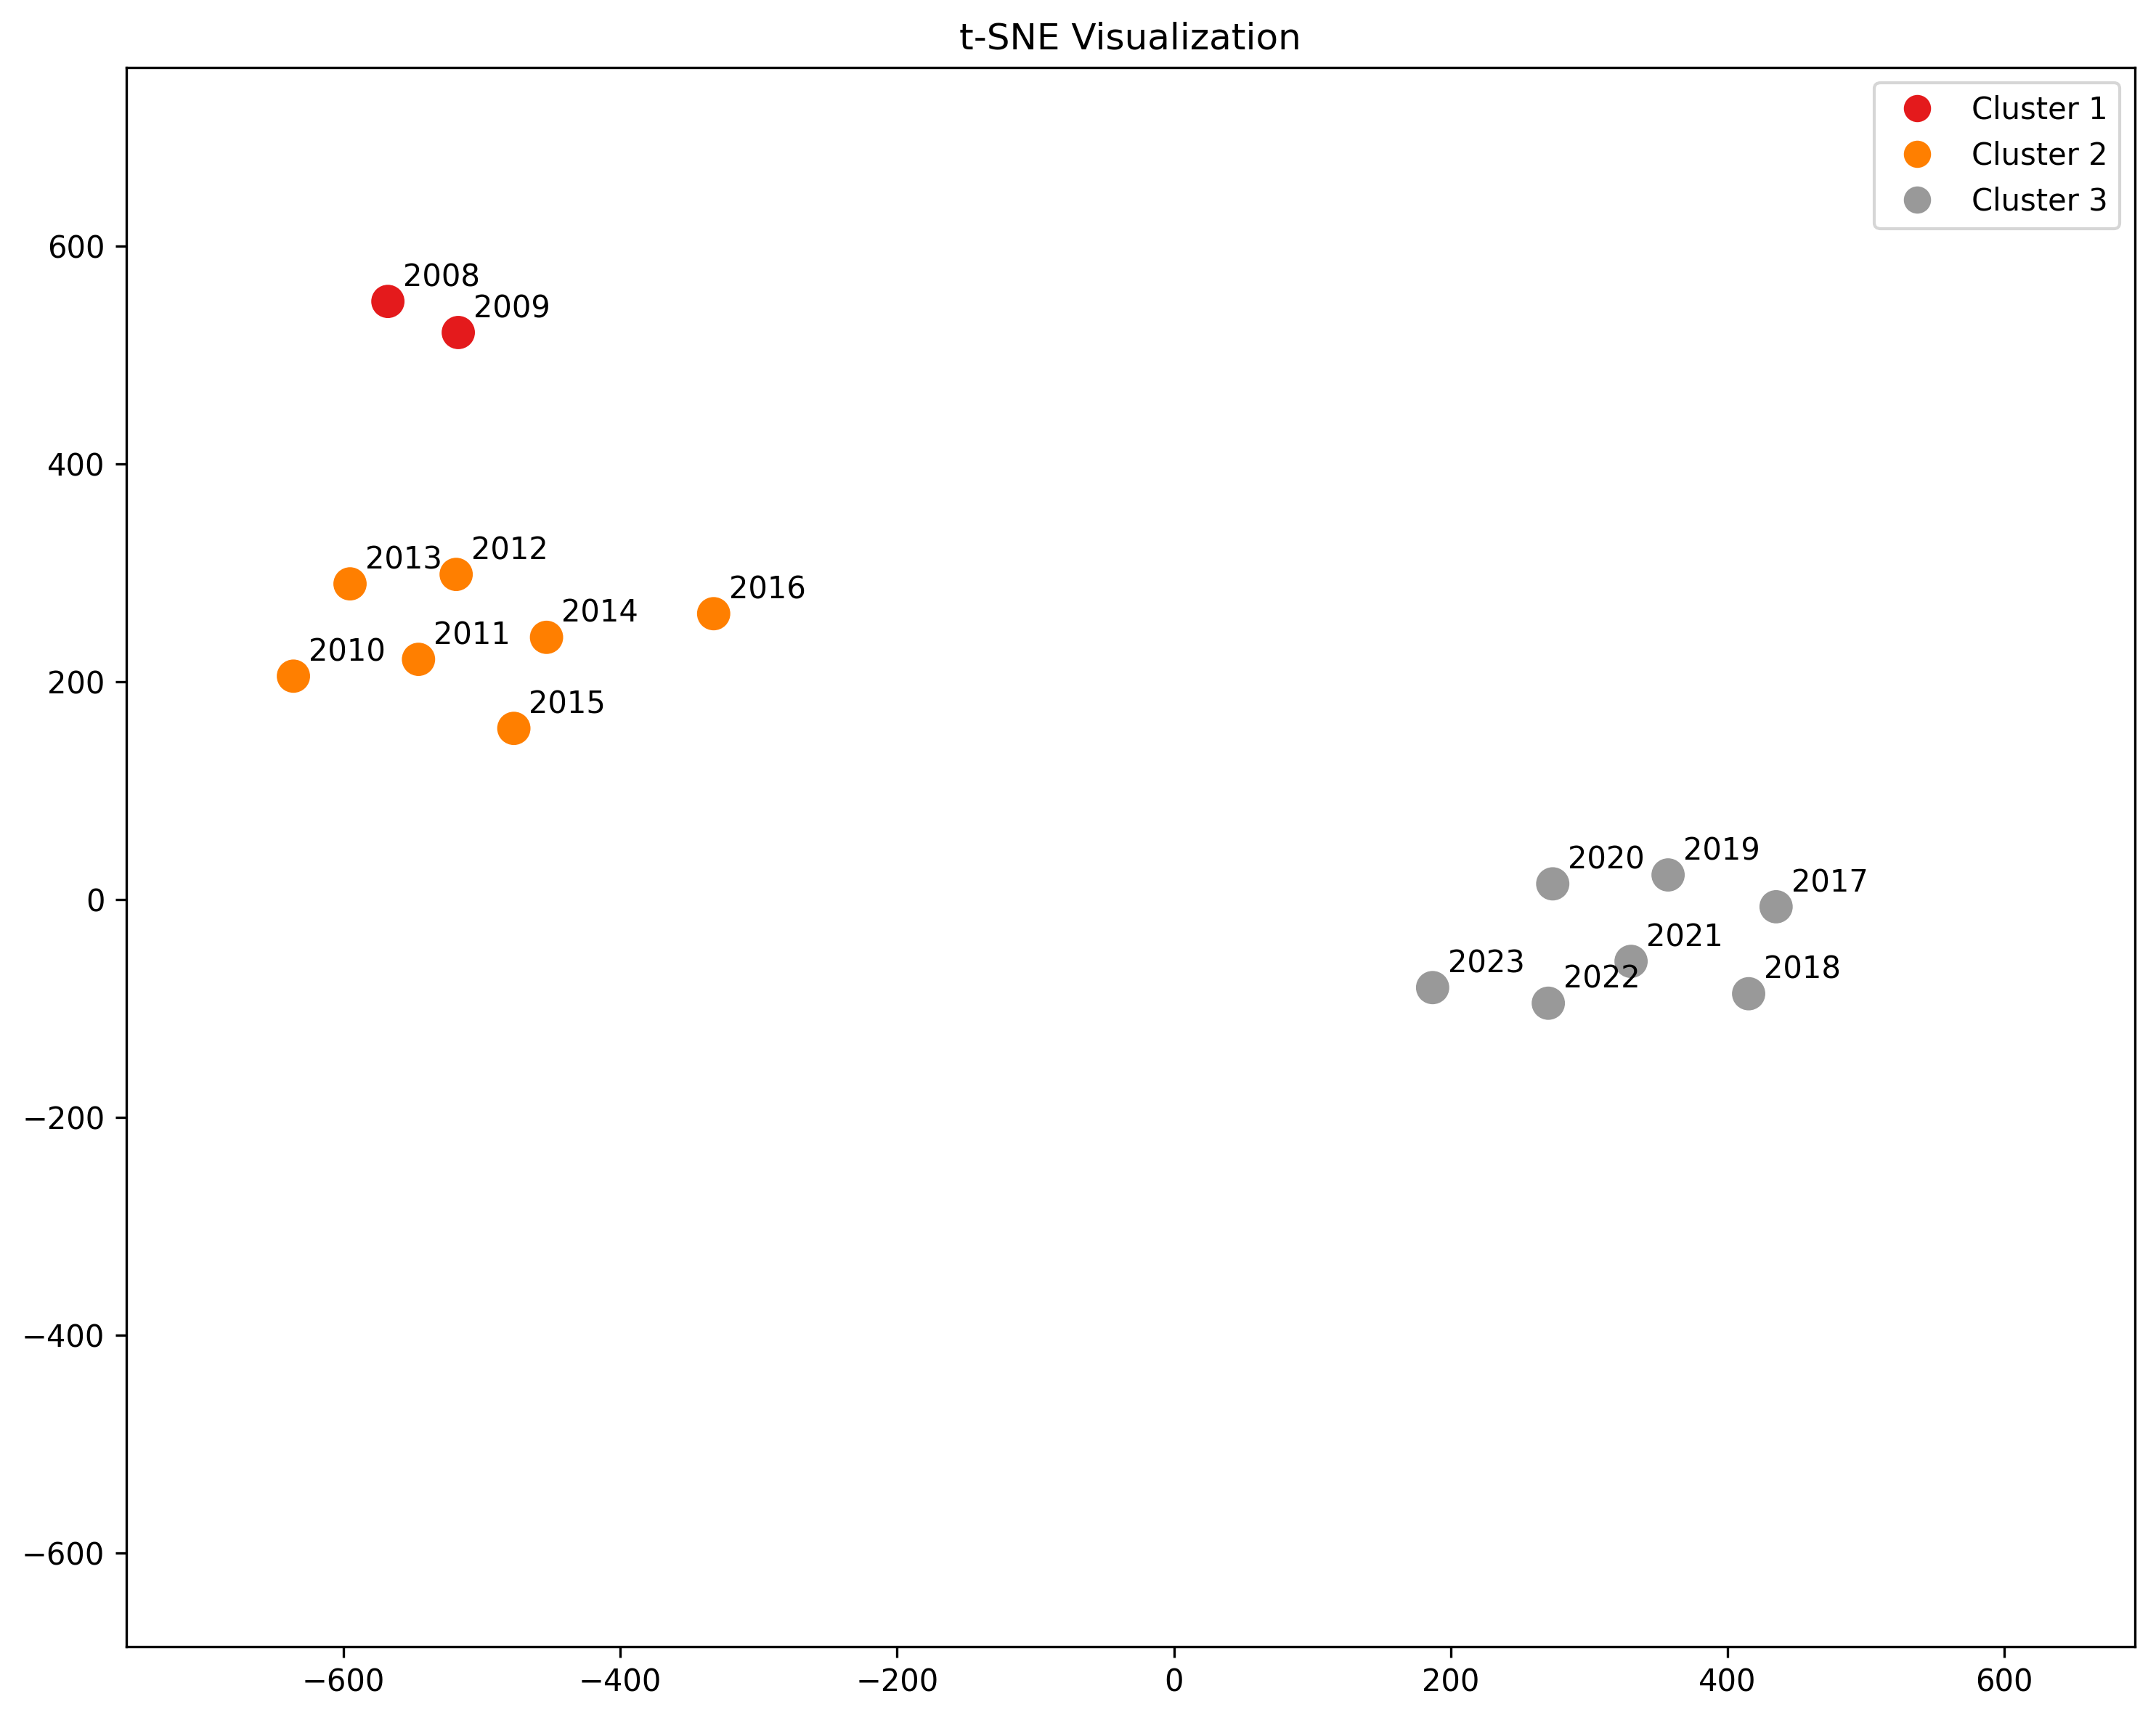
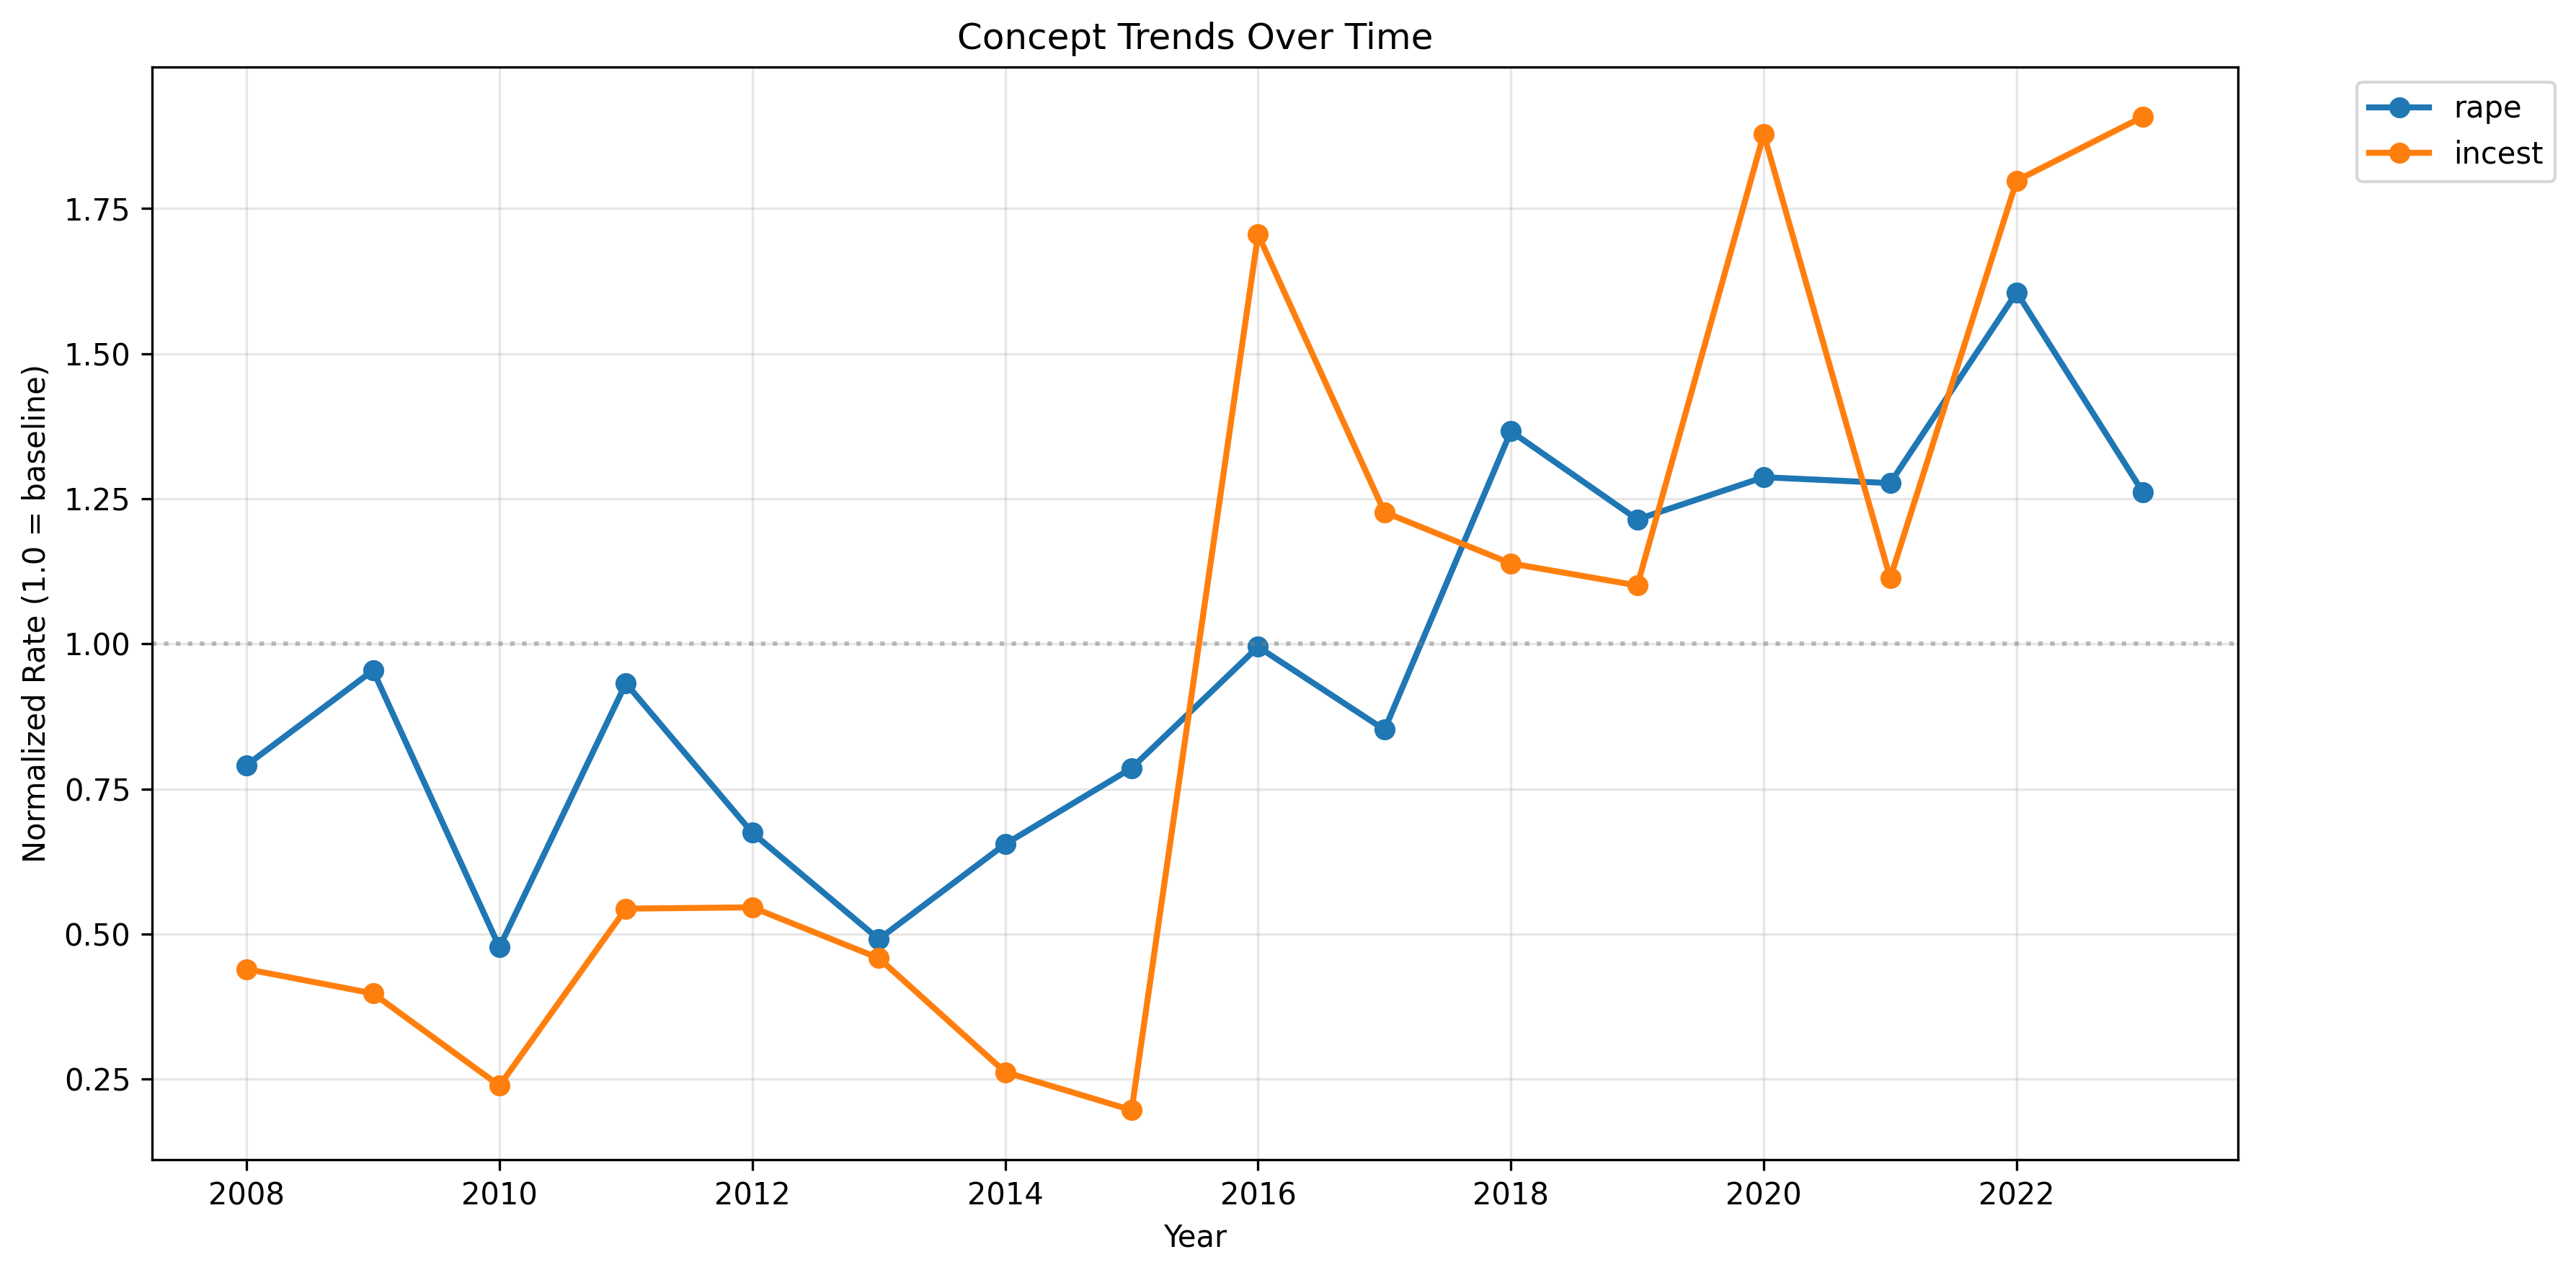
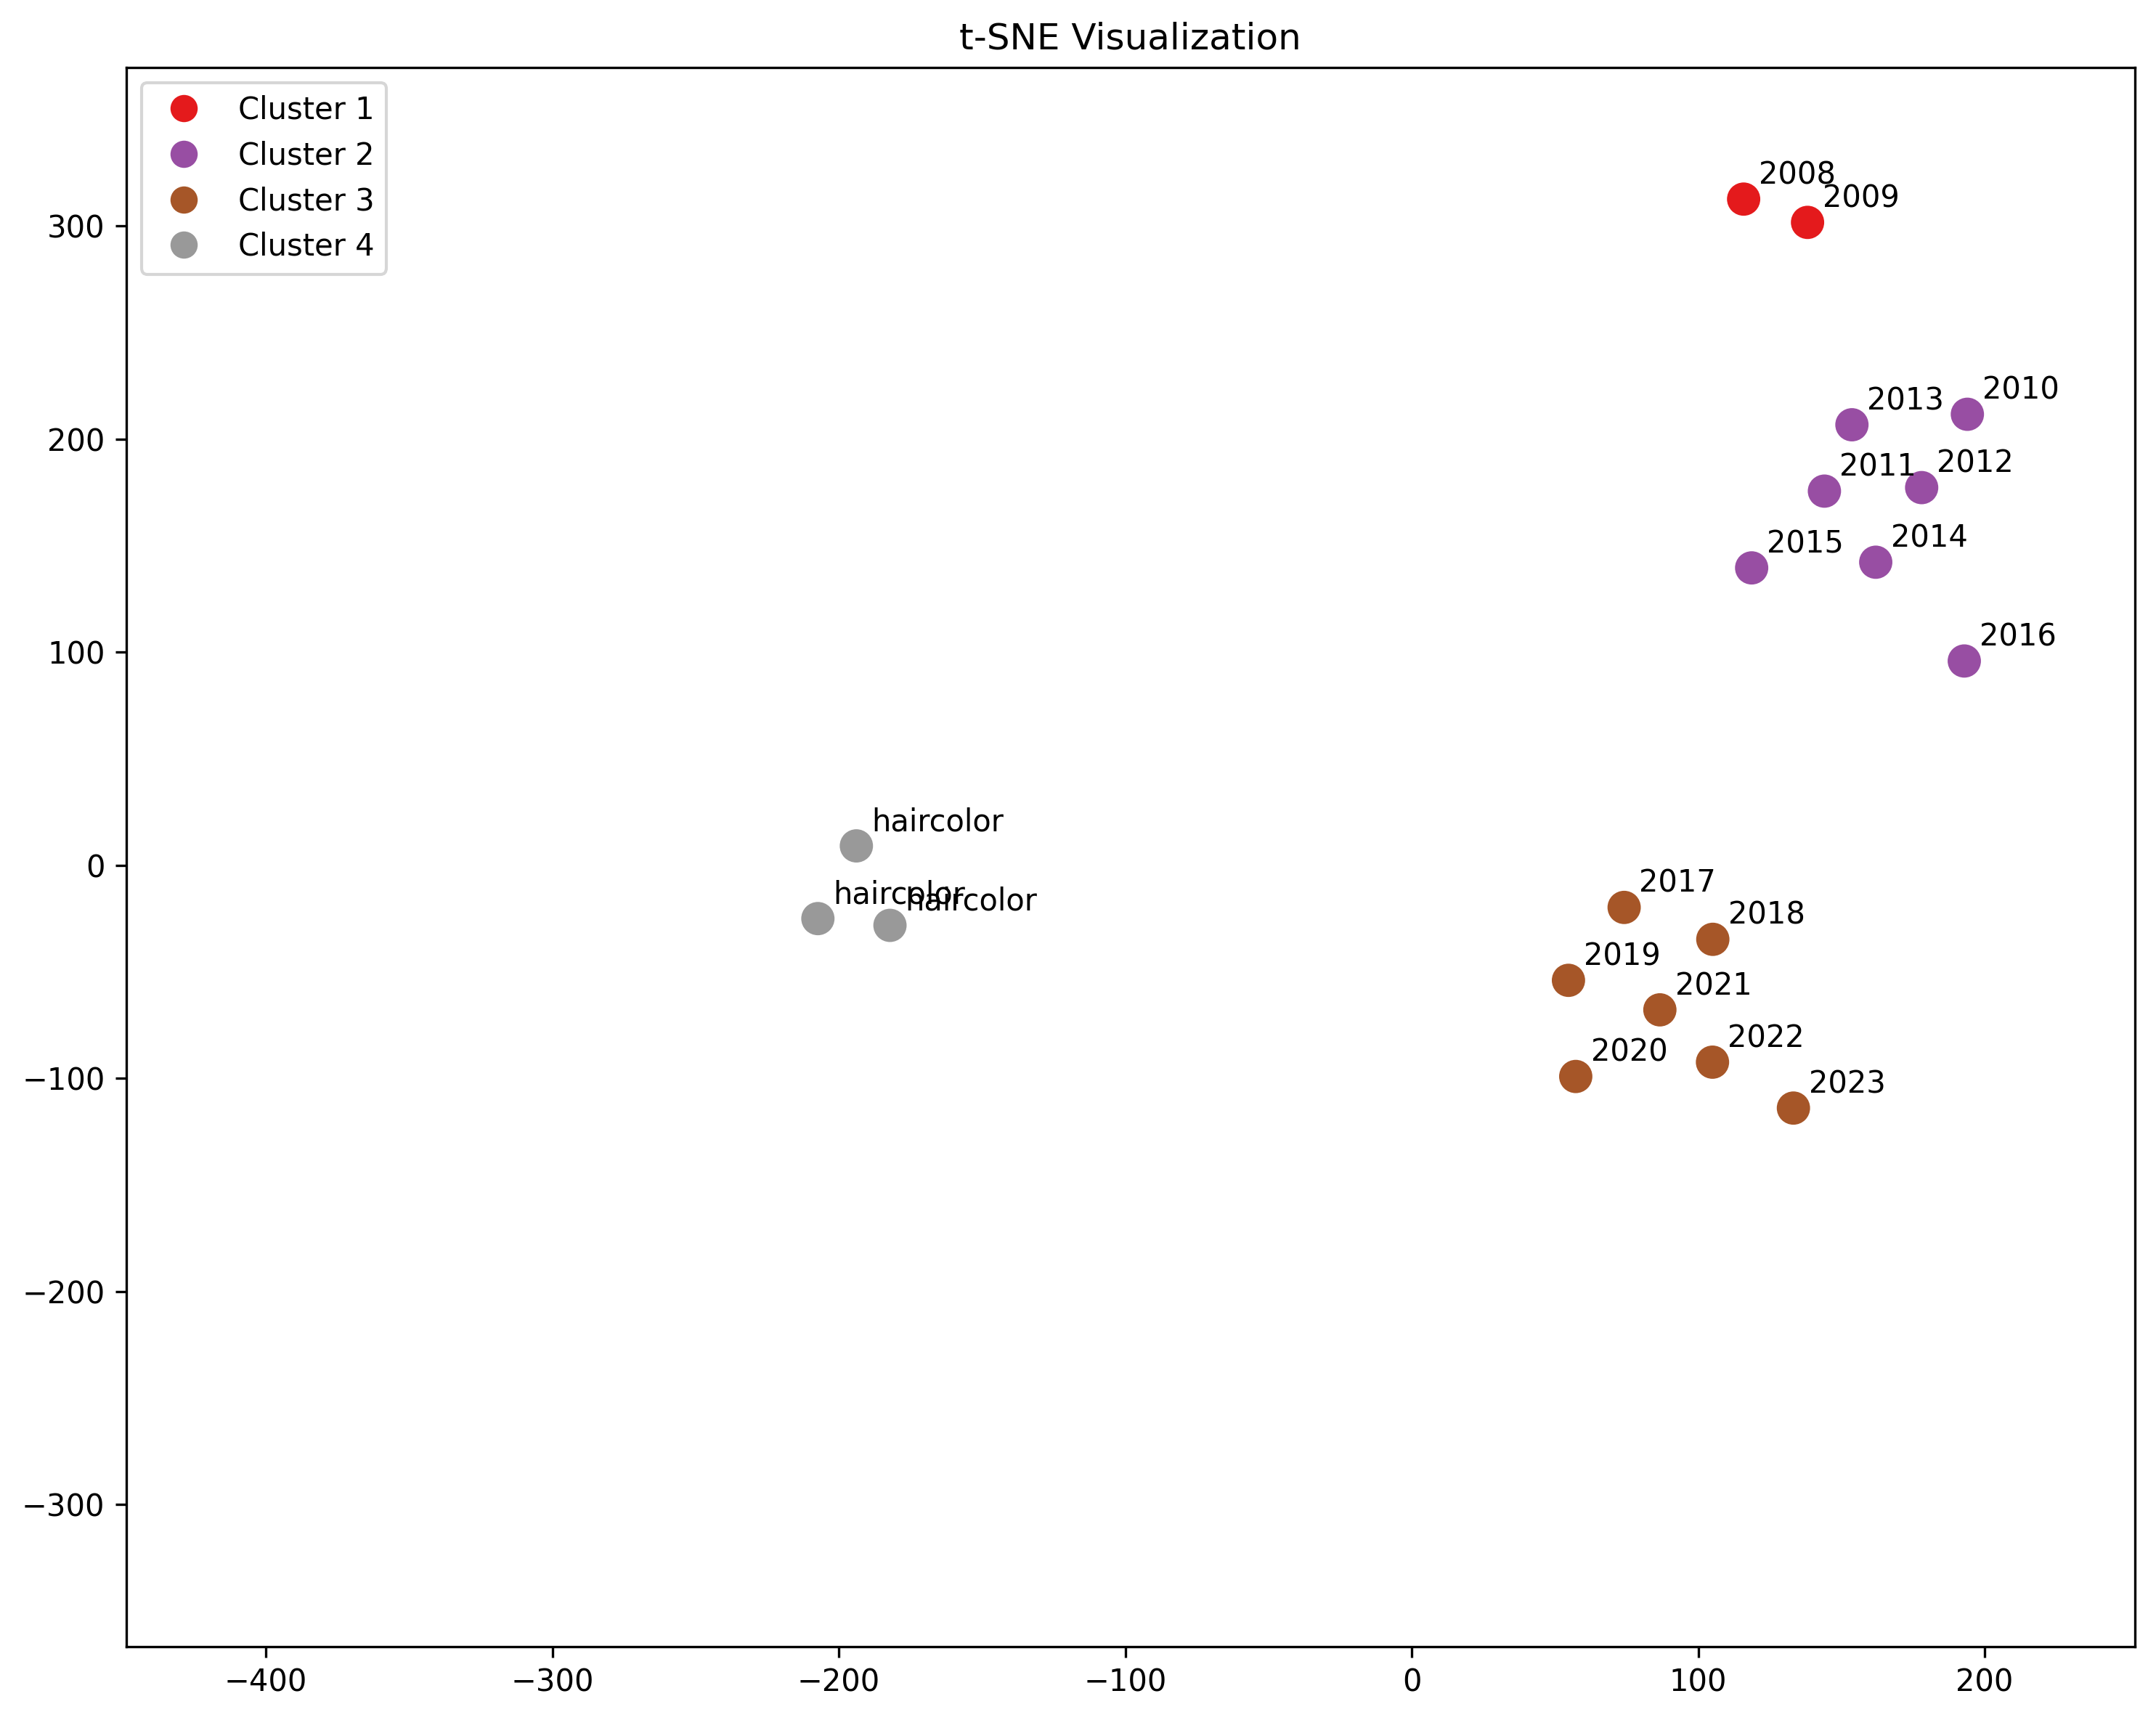
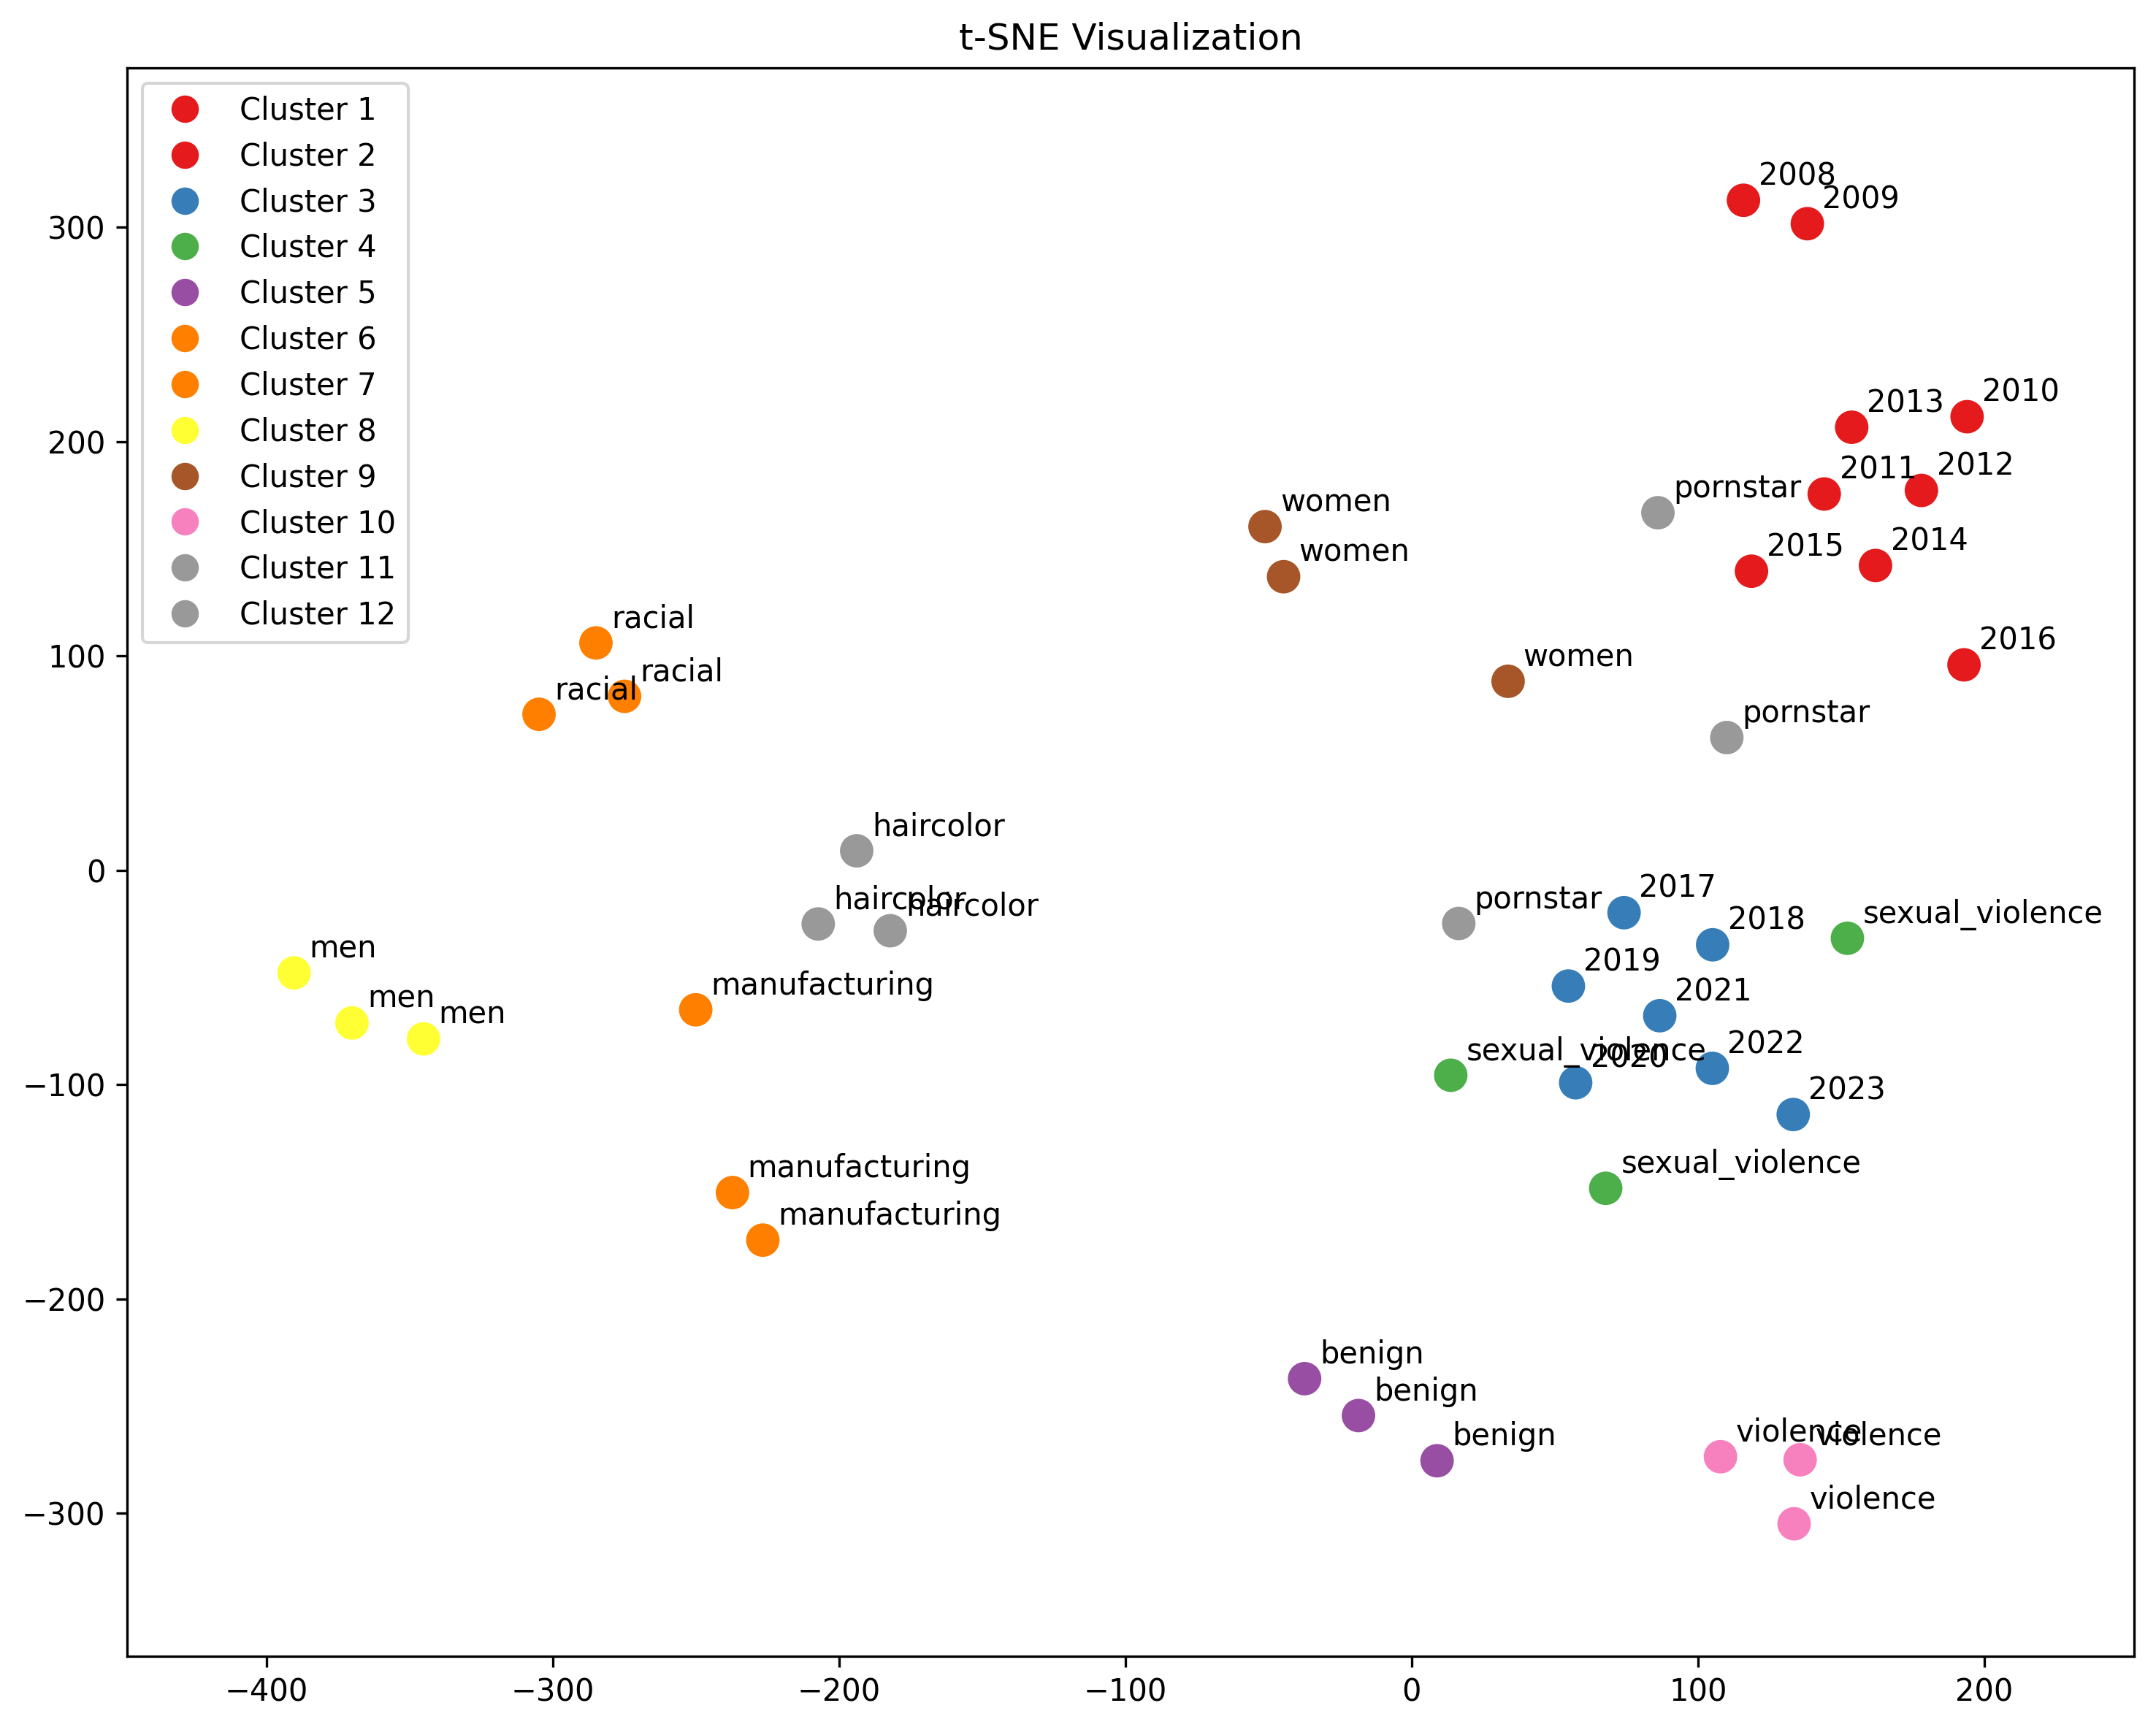
I found three distinct eras of titling: 2008-2009, 2010-2016, 2017-present. The current trend, since 2017, is characterized mainly by an emphasis on incest and other sexual violence.
Titles are generally representative of actual video content, and provide a reasonable heuristic for measuring actual content change, though some SEO effects exist.
The conclusion is a slightly ominous one: we are close to semantic bedrock [...]
Outline:
(00:12) Summary
(01:32) Data and Methods
(03:17) Title Accuracy
(04:32) Calculating Yearly Centroids
(04:57) Centroid Similarity
(05:32) Centroid Clusters
(06:22) Centroid Titles
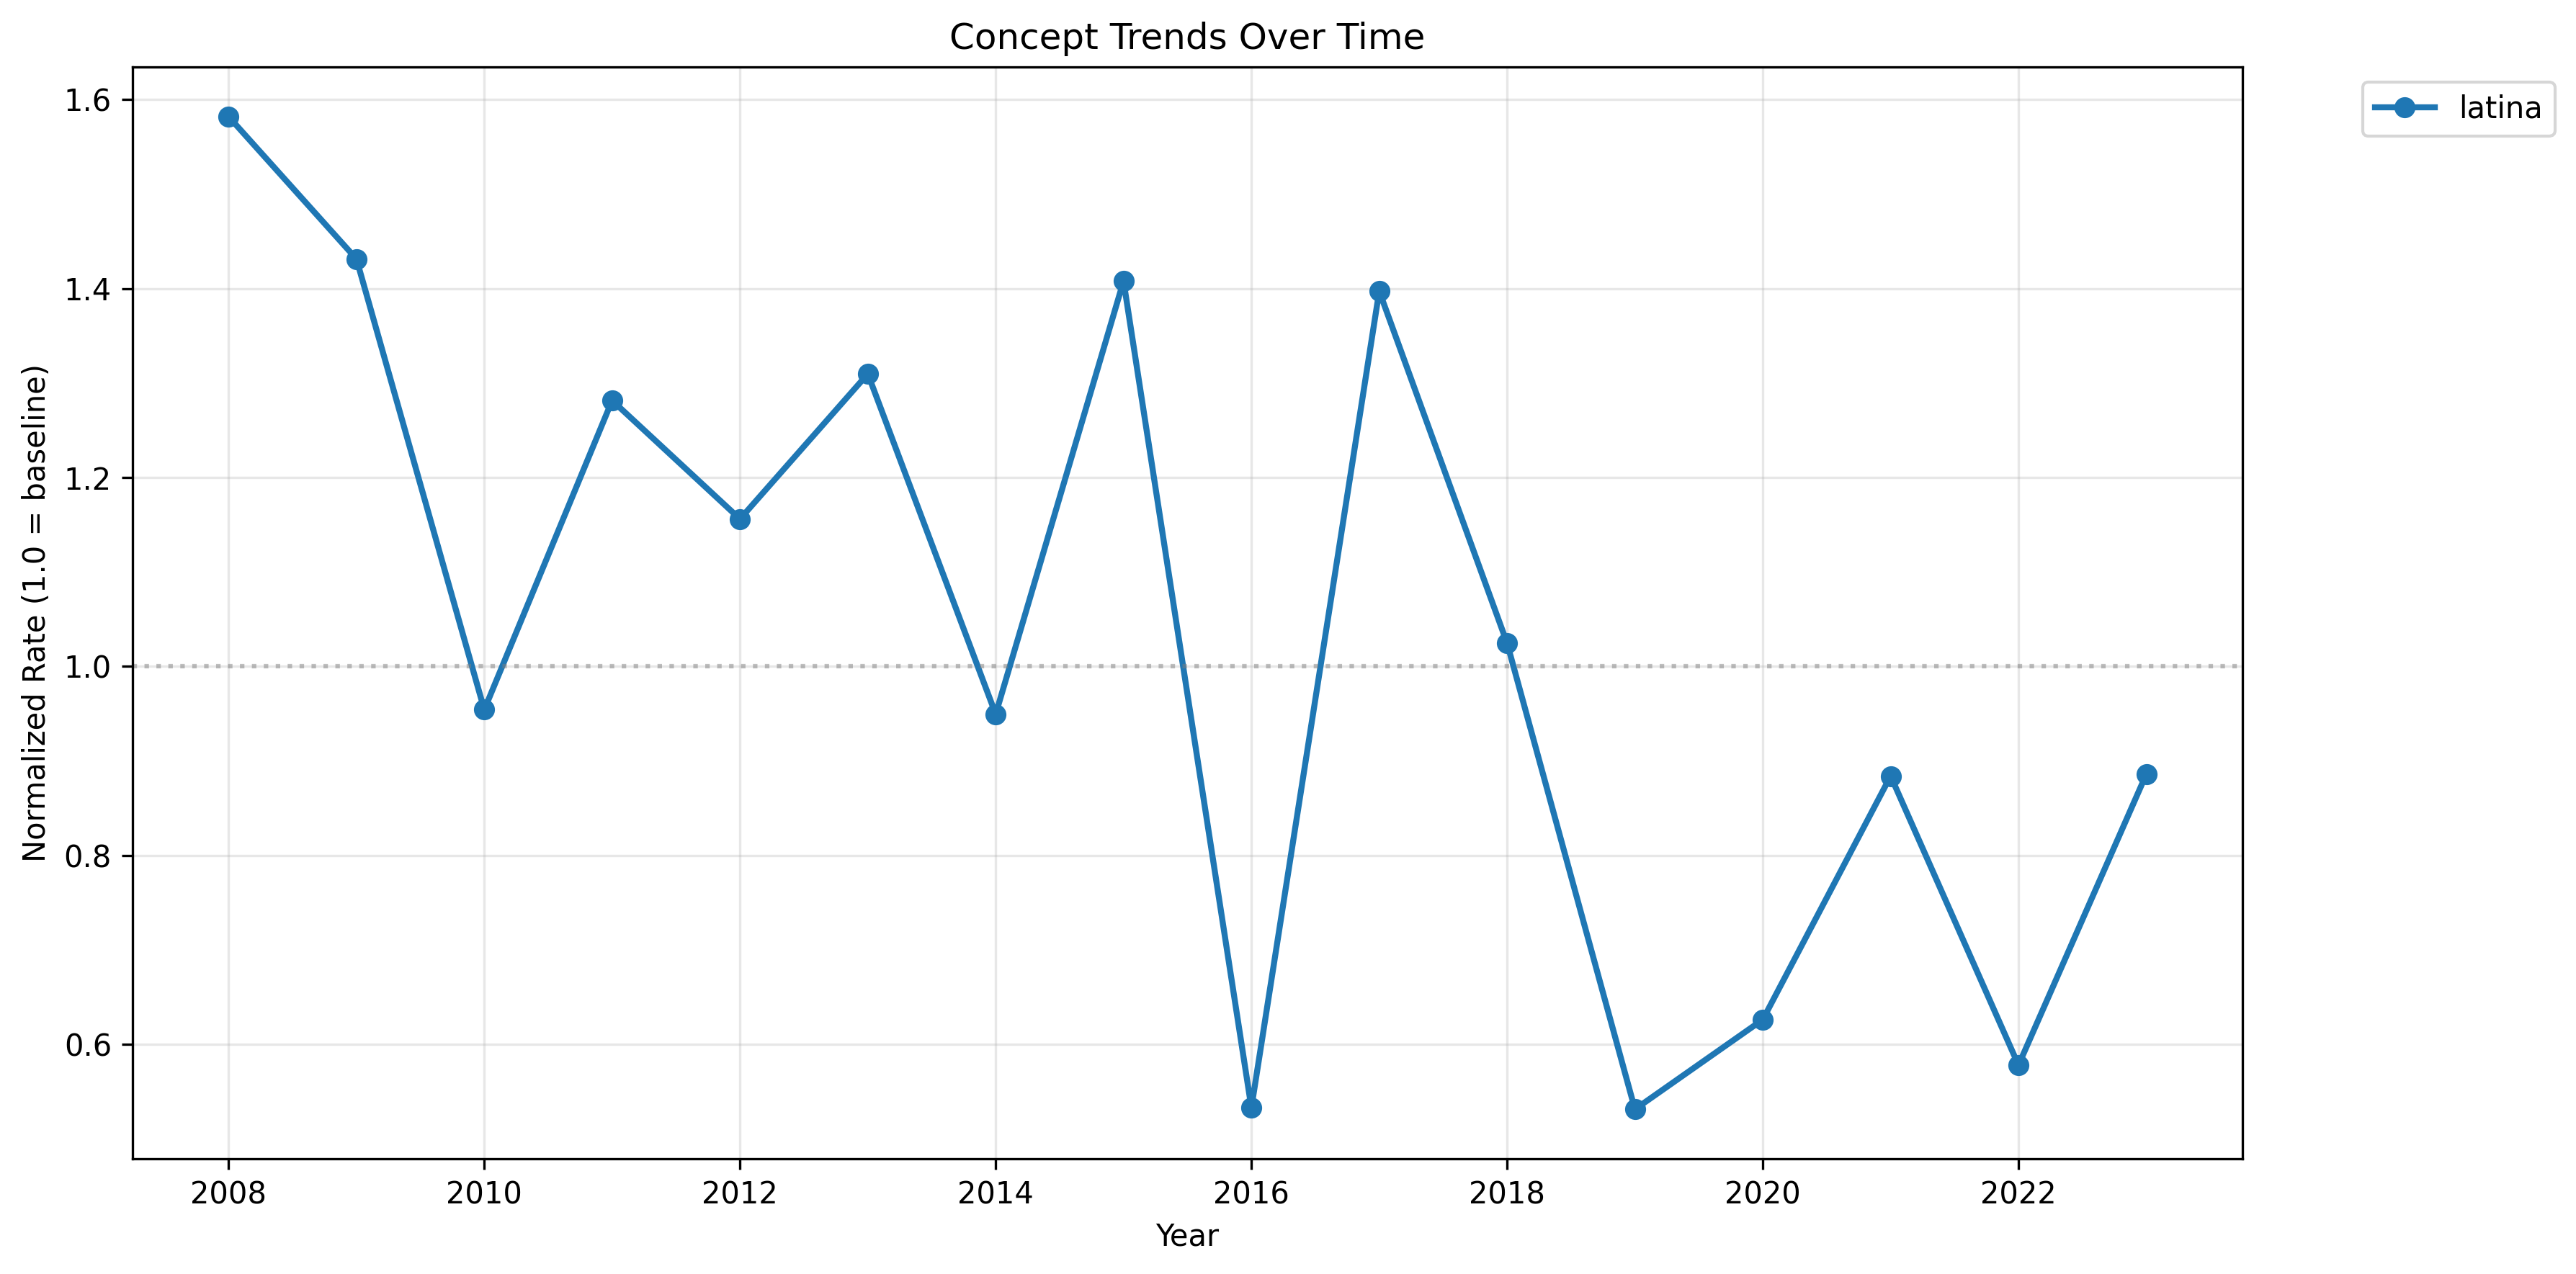
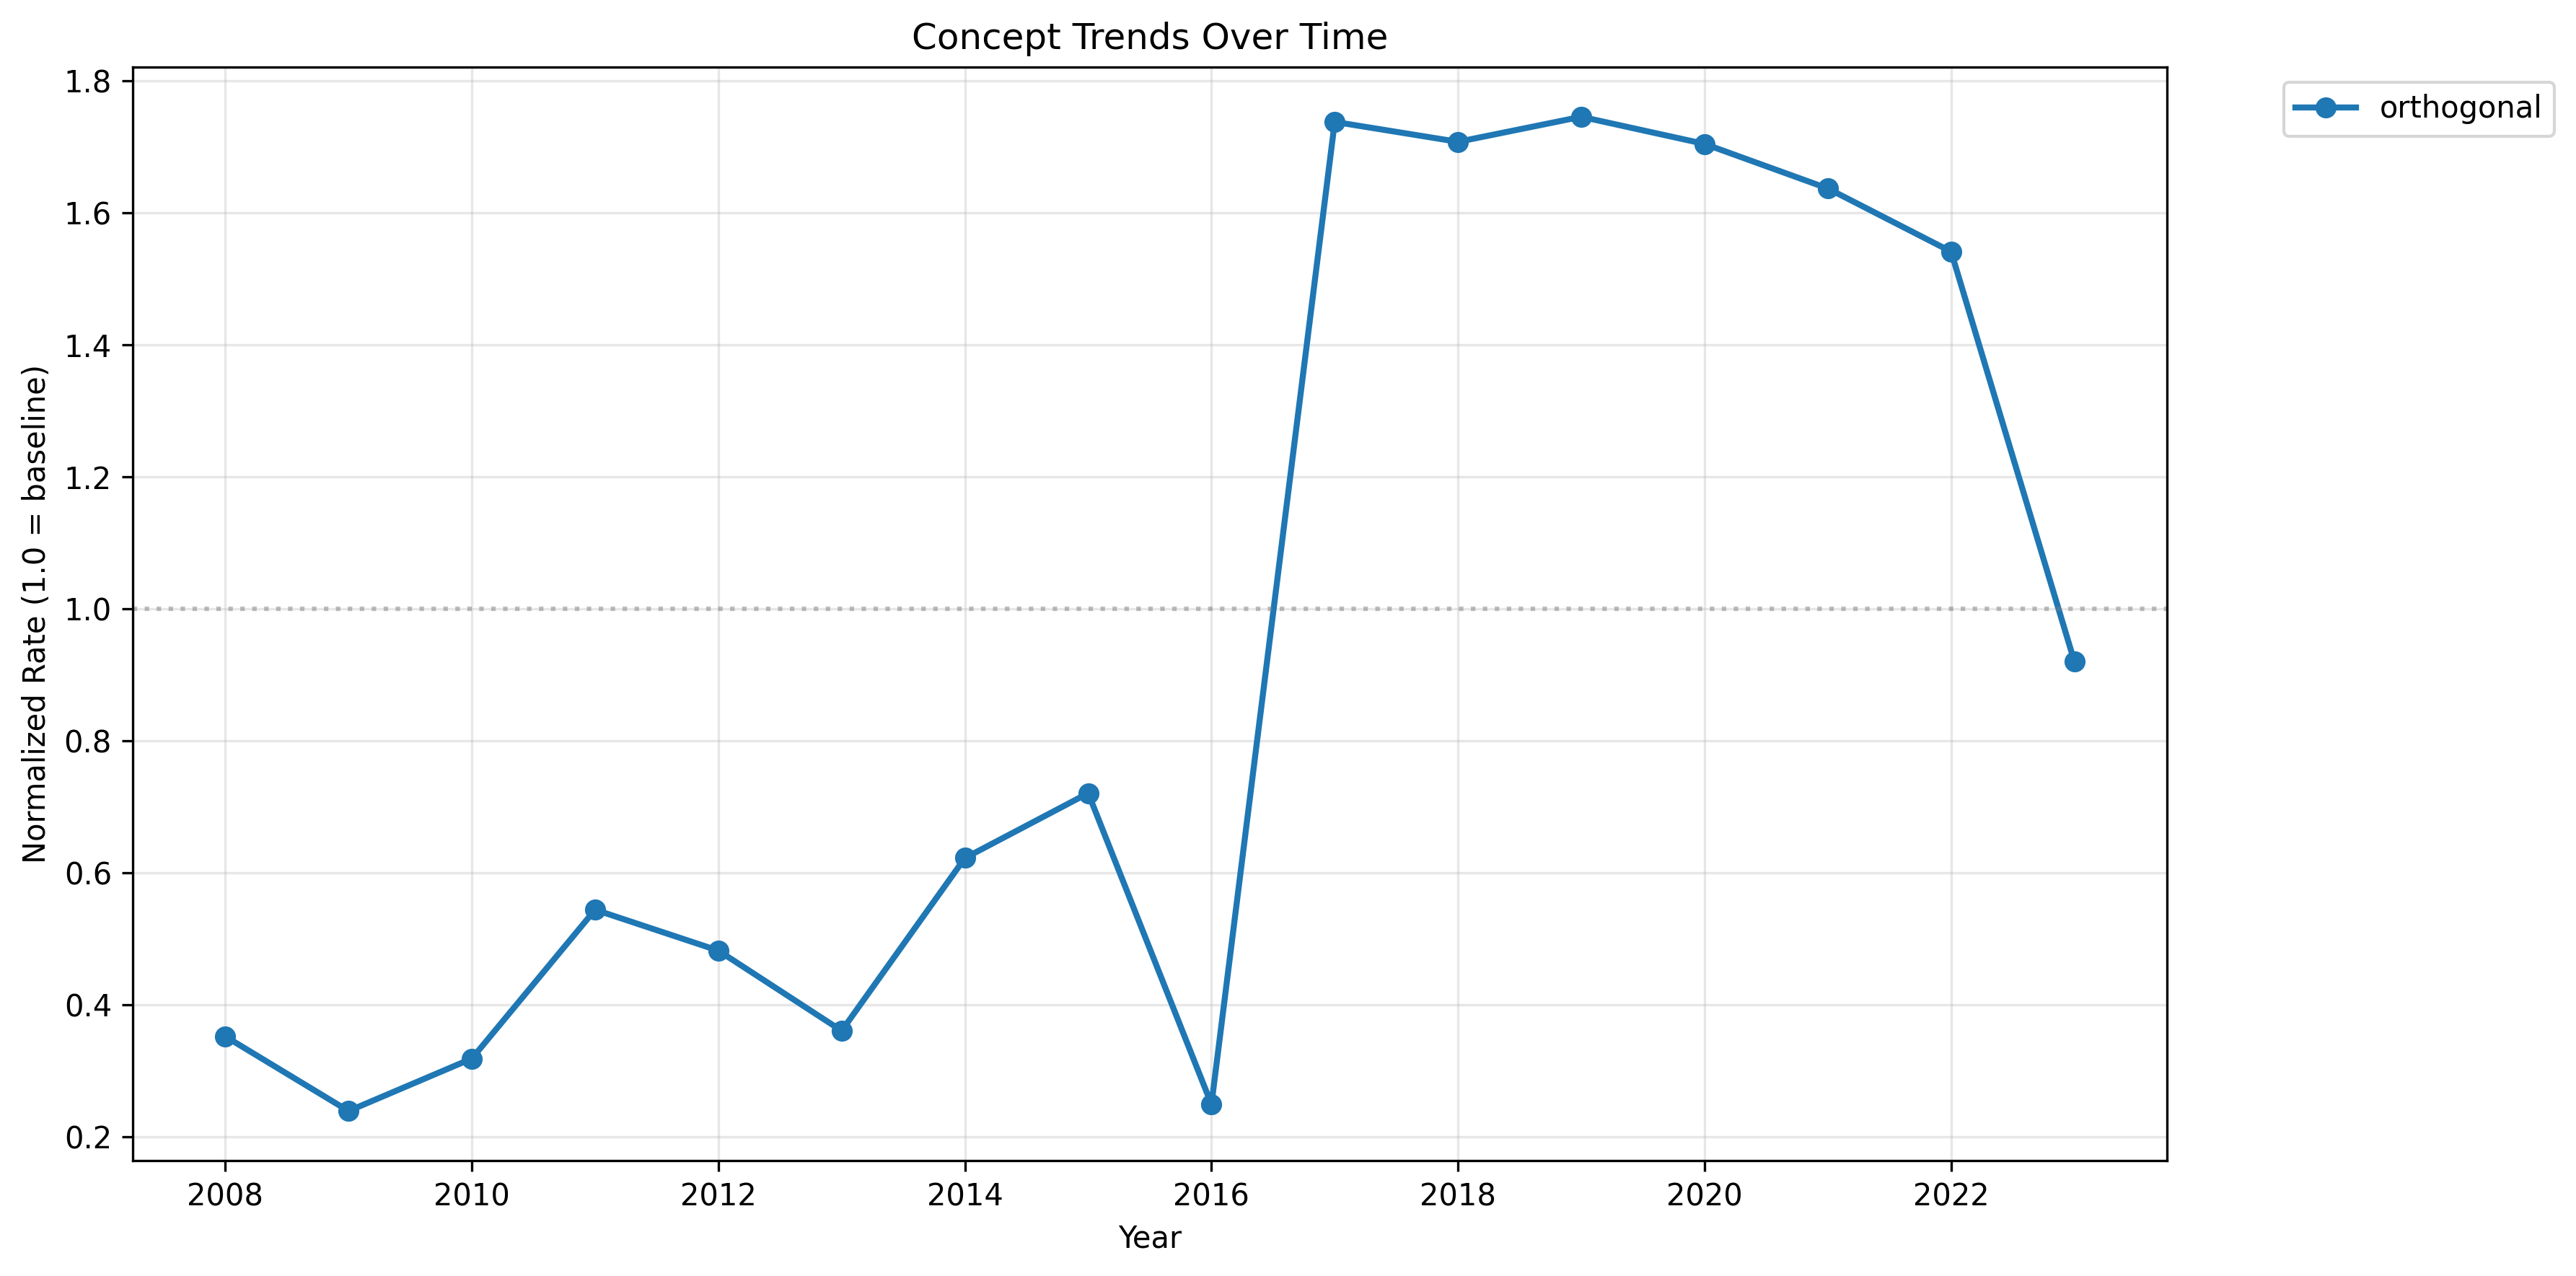
(08:57) Keyword Trends
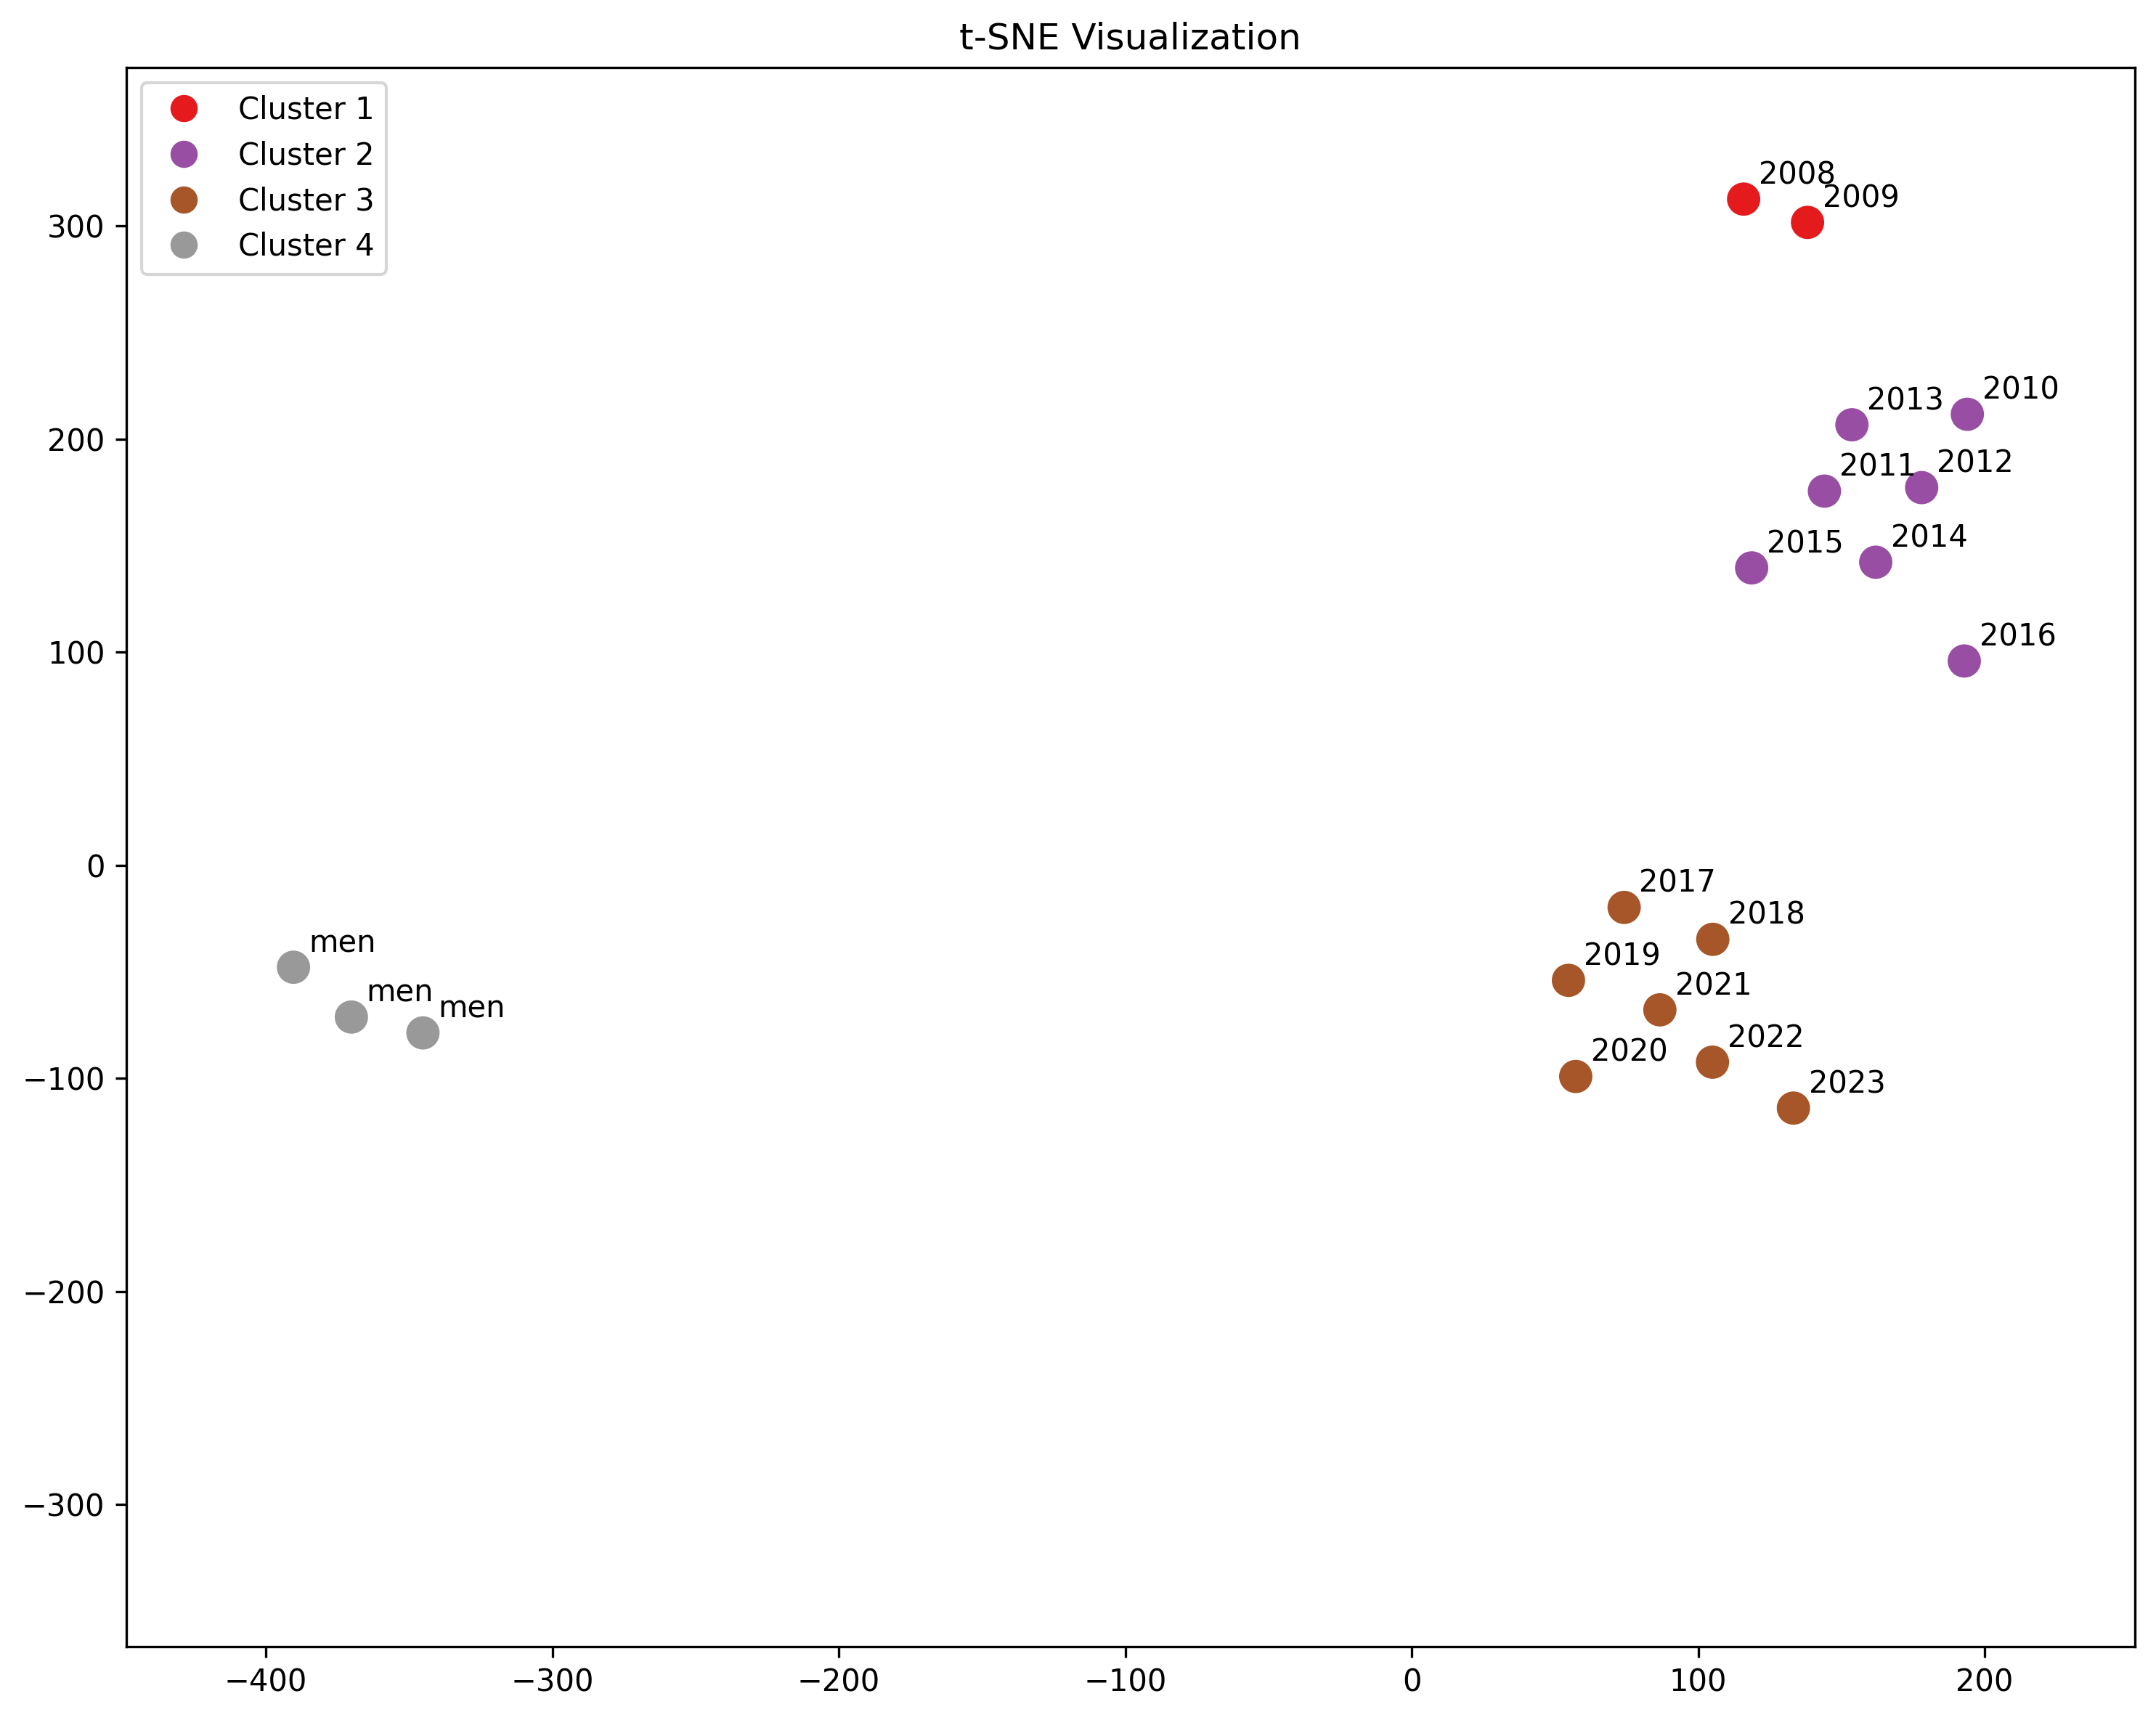
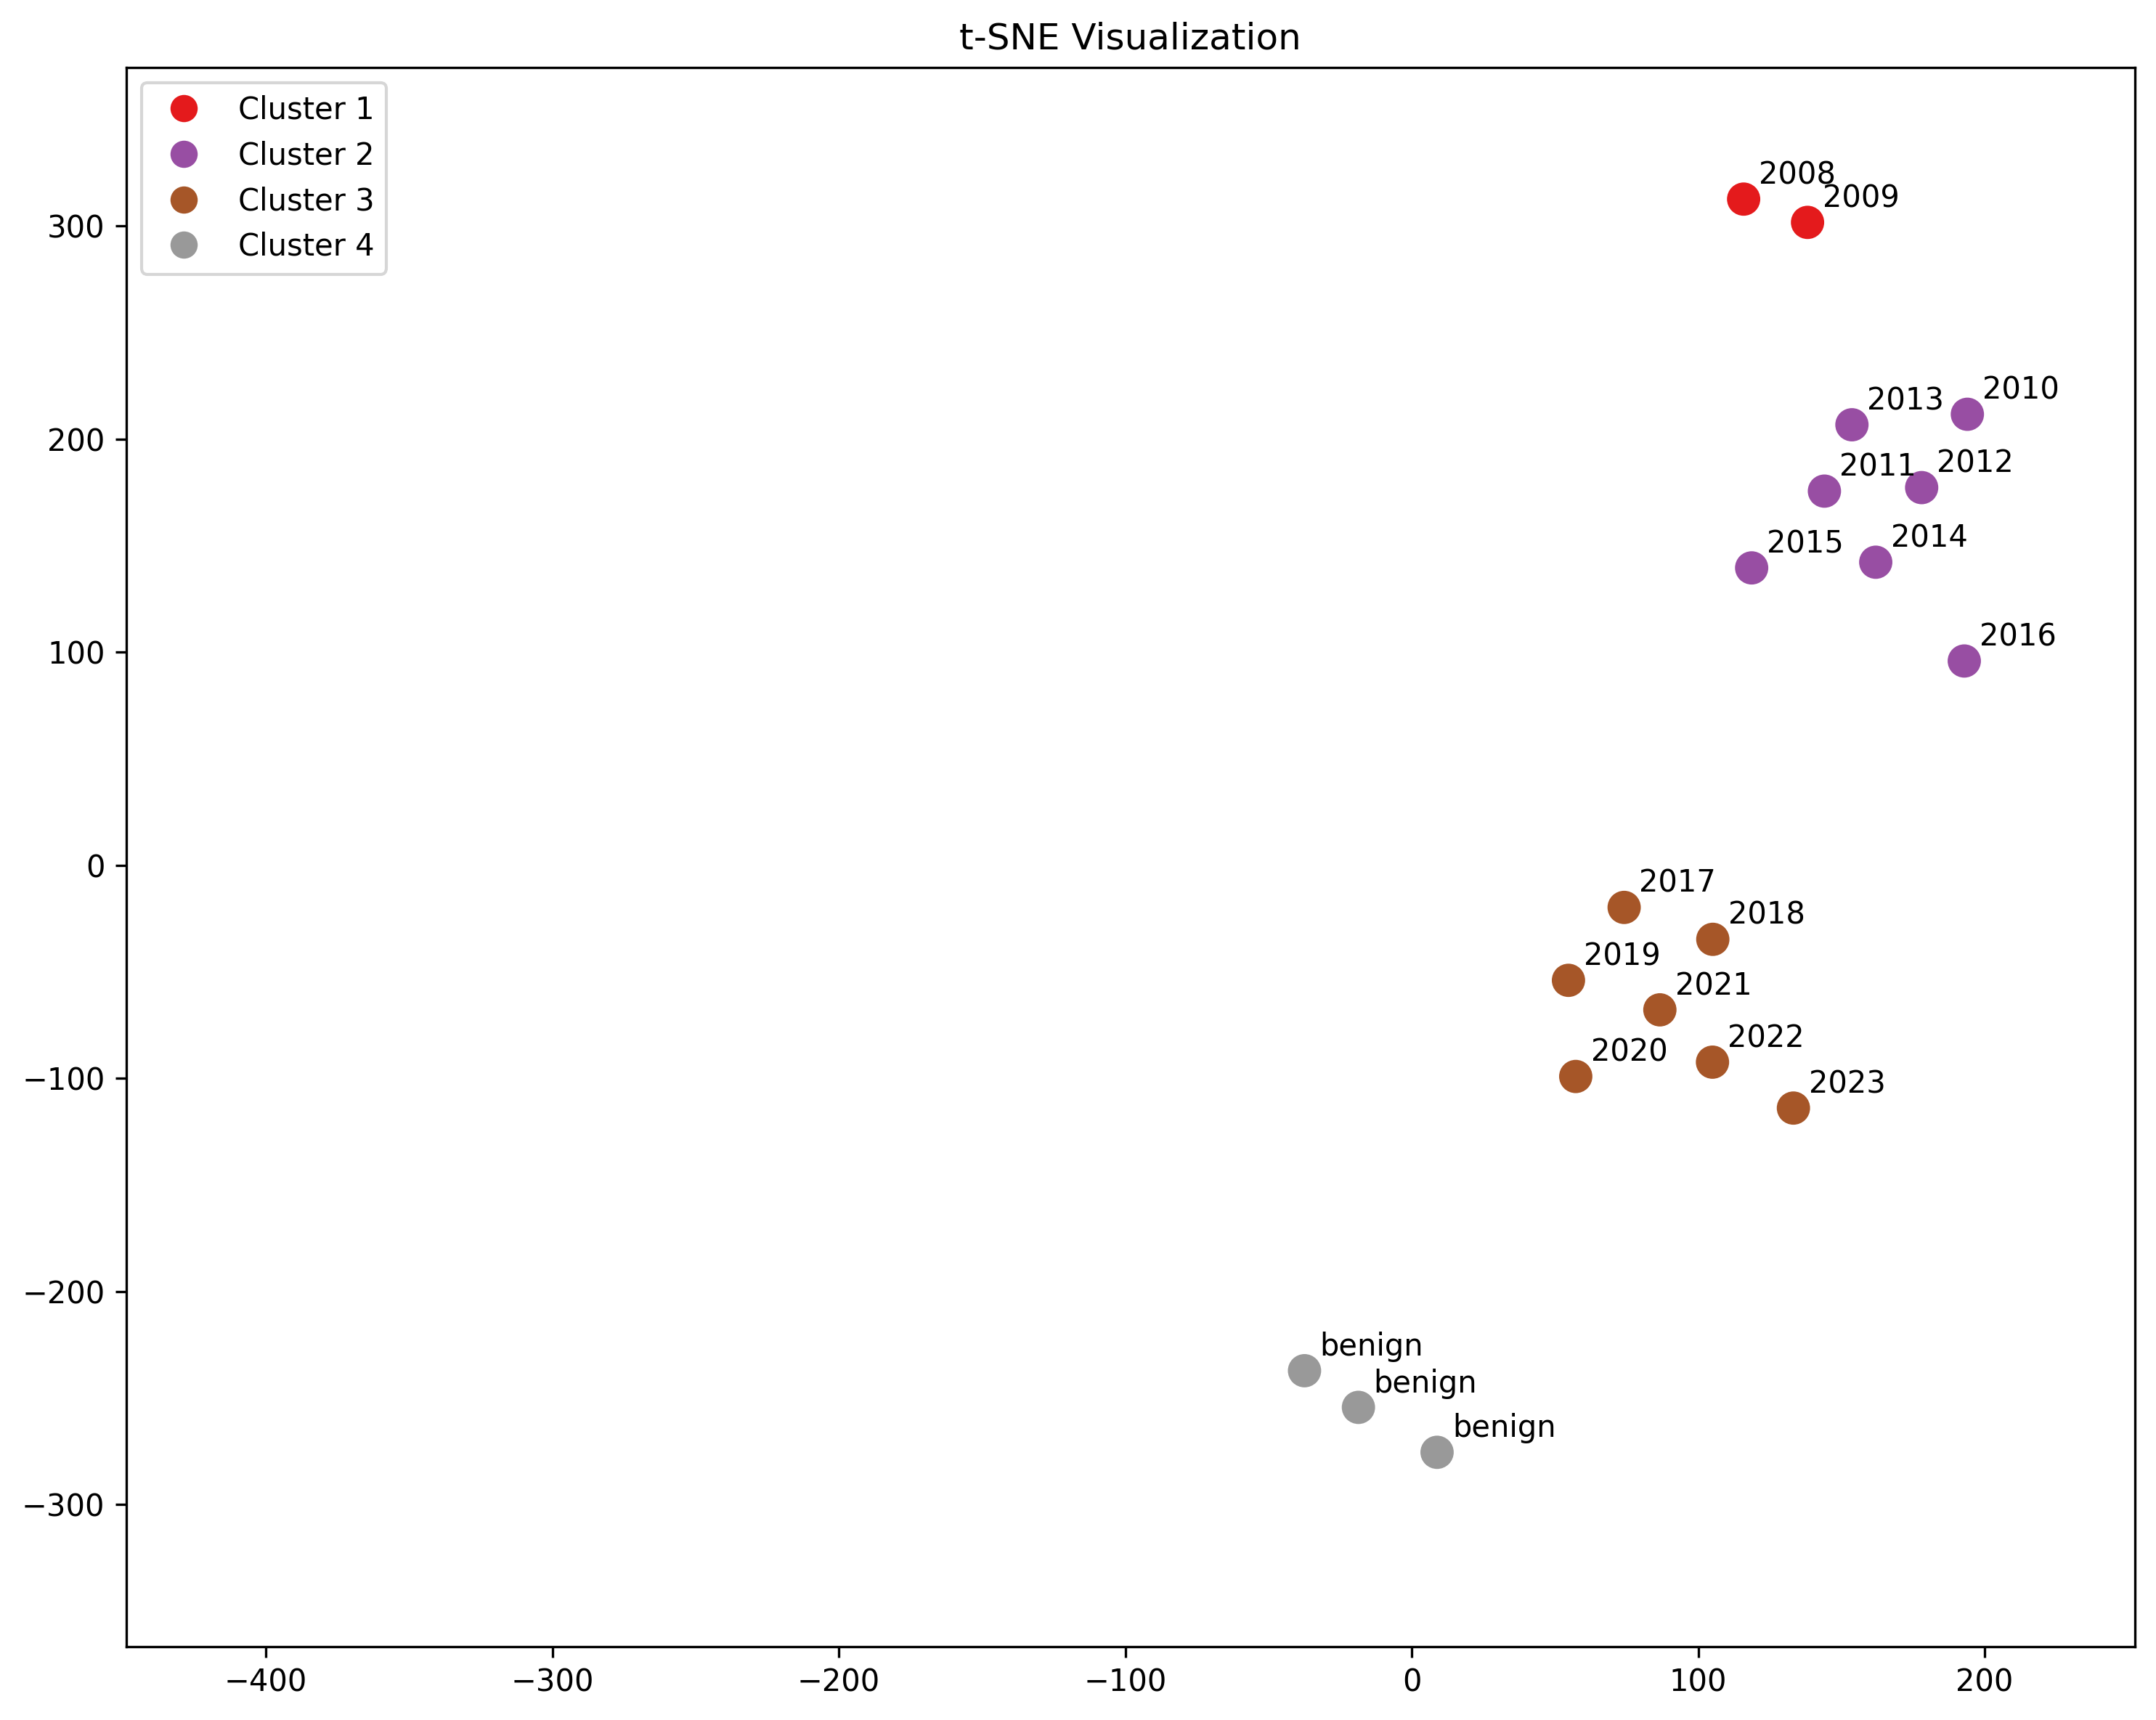
(11:30) t-SNE Clusters
(11:55) Haircolor
(12:22) Pornstar Names
(12:50) Violence
(13:14) Women
(13:36) Men
(14:02) Racial
(14:25) Manufacturing
(15:02) Benign
(15:29) Sexual Violence
(16:58) Conclusions
First published: May 19th, 2025
---
Narrated by TYPE III AUDIO).
Images from the article:
 )
) )
) )
) )
) )
) )
) )
) )
) )
) )
) )
) )
) ))))) Apple Podcasts and Spotify do not show images in the episode description. Try Pocket Casts), or another podcast app.
)!%5BLine)
)!%5Bt-SNE)
](https://39669.cdn.cke-cs.com/rQvD3VnunXZu34m86e5f/images/01b98d0843daac55f28f9fdb1691d16678a7ea9fbf521c0d.png))!%5B%5D(https://39669.cdn.cke-cs.com/rQvD3VnunXZu34m86e5f/images/0421d2c6afa922e927a2a4fc6c5701c81cf100643cba8a3d.png))